Zynga 2011 Annual Report Download - page 75
Download and view the complete annual report
Please find page 75 of the 2011 Zynga annual report below. You can navigate through the pages in the report by either clicking on the pages listed below, or by using the keyword search tool below to find specific information within the annual report.-
 1
1 -
2
-
3
-
4
-
5
-
6
-
7
-
8
-
9
-
10
-
11
-
12
-
13
-
14
-
15
-
16
-
17
-
18
-
19
-
20
-
21
-
22
-
23
-
24
-
25
-
26
-
27
-
28
-
29
-
30
-
31
-
32
-
33
-
34
-
35
-
36
-
37
-
38
-
39
-
40
-
41
-
42
-
43
-
44
-
45
-
46
-
47
-
48
-
49
-
50
-
51
-
52
-
53
-
54
-
55
-
56
-
57
-
58
-
59
-
60
-
61
-
62
-
63
-
64
-
 65
65 -
 66
66 -
 67
67 -
 68
68 -
 69
69 -
 70
70 -
 71
71 -
 72
72 -
 73
73 -
 74
74 -
 75
75 -
 76
76 -
 77
77 -
 78
78 -
 79
79 -
 80
80 -
 81
81 -
 82
82 -
 83
83 -
 84
84 -
 85
85 -
86
-
87
-
88
-
89
-
90
-
91
-
92
-
93
-
94
-
95
-
96
-
97
-
98
-
99
-
100
-
101
-
102
-
103
-
104
 |
 |

Table of Contents
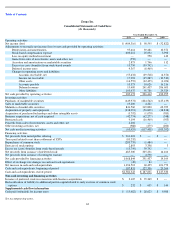
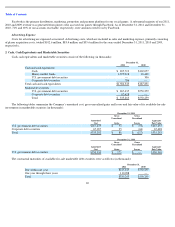
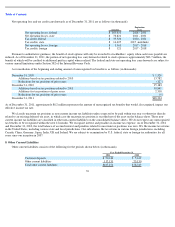
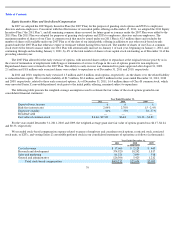
The composition of our securities among the three levels of the fair value hierarchy is as follows at December 31, 2011 and 2010,
respectively (in thousands):
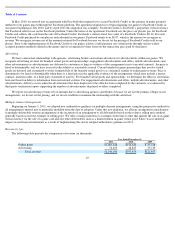
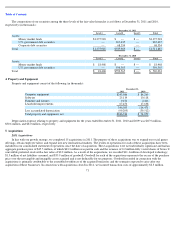
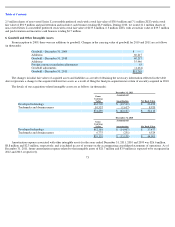
4. Property and Equipment
Property and equipment consist of the following (in thousands):
Depreciation expense relating to property and equipment for the years ended December 31, 2011, 2010 and 2009 was $65.9 million,
$30.6 million, and $8.0 million, respectively.
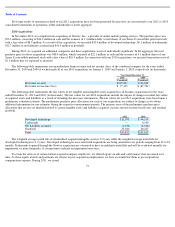
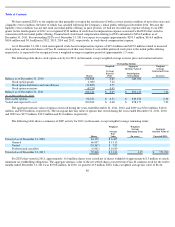
5. Acquisitions
2011 Acquisitions
In line with our growth strategy, we completed 15 acquisitions in 2011. The purpose of these acquisitions was to expand our social games
offerings, obtain employee talent, and expand into new international markets. The results of operations for each of these acquisitions have been
included in our consolidated statement of operations since the date of acquisition. These acquisitions were not individually significant and had an
aggregate purchase price of $45.5 million, of which $43.3 million was paid in cash and the issuance of 0.2 million fully vested shares of Series Z
convertible preferred stock with a fair value of $2.2 million. As a result of the acquisitions, we recorded $11.1 million of developed technology,
$1.5 million of net liabilities assumed, and $35.9 million of goodwill. Goodwill for each of the acquisitions represents the excess of the purchase
price over the net tangible and intangible assets acquired and is not deductible for tax purposes. Goodwill recorded in connection with the
acquisitions is primarily attributable to the assembled workforces of the acquired businesses and the synergies expected to arise after our
acquisition of those businesses. In connection with acquisitions closed in 2011, we incurred transaction costs of approximately $2.3 million.
71
December 31, 2011
Level 1
Level 2
Level 3
Total
Assets:
Money market funds
$
1,375,918
$
—
$
—
$
1,375,918
U.S. government debt securities
—
267,635
—
267,635
Corporate debt securities
—
68,334
—
68,334
Total
$
1,375,918
$
335,969
$
—
$
1,711,887
December 31, 2010
Level 1
Level 2
Level 3
Total
Assets:
Money market funds
$
18,468
$
—
$
—
$
18,468
U.S. government debt securities
—
550,565
—
550,565
Total
$
18,468
$
550,565
$
—
$
569,033
December 31,
2011
2010
Computer equipment
$
243,986
$
84,269
Software
25,119
10,118
Furniture and fixtures
9,474
2,446
Leasehold improvements
67,456
17,638
346,035
114,471
Less accumulated depreciation
(99,295
)
(39,512
)
Total property and equipment, net
$
246,740
$
74,959