Zynga 2011 Annual Report Download - page 49
Download and view the complete annual report
Please find page 49 of the 2011 Zynga annual report below. You can navigate through the pages in the report by either clicking on the pages listed below, or by using the keyword search tool below to find specific information within the annual report.-
 1
1 -
2
-
3
-
4
-
5
-
6
-
7
-
8
-
9
-
10
-
11
-
12
-
13
-
14
-
15
-
16
-
17
-
18
-
19
-
20
-
21
-
22
-
23
-
24
-
25
-
26
-
27
-
28
-
29
-
30
-
31
-
32
-
33
-
34
-
35
-
36
-
37
-
38
-
 39
39 -
 40
40 -
 41
41 -
 42
42 -
 43
43 -
 44
44 -
 45
45 -
 46
46 -
 47
47 -
 48
48 -
 49
49 -
 50
50 -
 51
51 -
 52
52 -
 53
53 -
 54
54 -
 55
55 -
 56
56 -
 57
57 -
 58
58 -
 59
59 -
60
-
61
-
62
-
63
-
64
-
65
-
66
-
67
-
68
-
69
-
70
-
71
-
72
-
73
-
74
-
75
-
76
-
77
-
78
-
79
-
80
-
81
-
82
-
83
-
84
-
85
-
86
-
87
-
88
-
89
-
90
-
91
-
92
-
93
-
94
-
95
-
96
-
97
-
98
-
99
-
100
-
101
-
102
-
103
-
104
 |
 |

Table of Contents
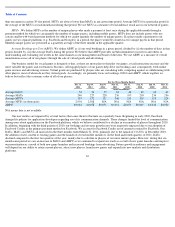
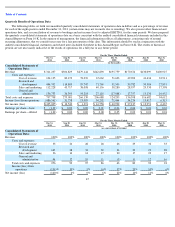
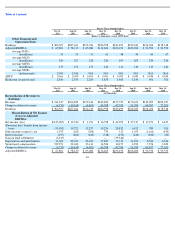
Quarterly Results of Operations Data
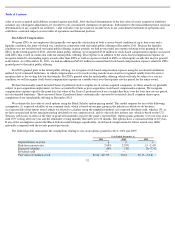
The following tables set forth our unaudited quarterly consolidated statements of operations data in dollars and as a percentage of revenue
for each of the eight quarters ended December 31, 2011 (certain items may not reconcile due to rounding). We also present other financial and
operations data, and a reconciliation of revenue to bookings and net income (loss) to adjusted EBITDA, for the same periods. We have prepared
the quarterly consolidated statements of operations data on a basis consistent with the audited consolidated financial statements included in this
Annual Report on Form 10-K. In the opinion of management, the financial information reflects all adjustments, consisting only of normal
recurring adjustments, that we consider necessary for a fair presentation of this data. This information should be read in conjunction with the
audited consolidated financial statements and related notes included elsewhere in this Annual Report on Form 10-K. The results of historical
periods are not necessarily indicative of the results of operations for a full year or any future period.
45
For the Three Months Ended:
Dec 31,
2011
Sep 30,
2011
Jun 30,
2011
Mar 31,
2011
Dec 31,
2010
Sep 30,
2010
Jun 30,
2010
Mar 31,
2010
(in thousands)
Consolidated Statements of
Operations Data:
Revenue
$
311,237
$
306,829
$
279,144
$
242,890
$
195,759
$
170,674
$
130,099
$
100,927
Costs and expenses:
Cost of revenue
104,135
80,170
78,076
67,662
51,603
49,902
41,636
32,911
Research and
development
444,702
114,809
95,747
71,760
51,500
39,782
30,386
27,851
Sales and marketing
112,228
43,717
38,098
40,156
38,280
28,957
29,530
17,398
General and
administrative
136,733
36,395
54,218
27,110
(17,088
)
17,757
15,130
16,452
Total costs and expenses
797,798
275,091
266,139
206,688
124,295
136,398
116,682
94,612
Income (loss) from operations
(486,561
)
31,738
13,005
36,202
71,464
34,276
13,417
6,315
Net income (loss)
$
(435,005
)
$
12,540
$
1,391
$
16,758
$
42,992
$
27,217
$
13,951
$
6,435
Earnings per share
—
basic
$
(1.22
)
$
0.00
$
0.00
$
0.01
$
0.06
$
0.04
$
0.01
$
0.01
Earnings per share
—
diluted
$
(1.22
)
$
0.00
$
0.00
$
0.00
$
0.05
$
0.03
$
0.01
$
0.01
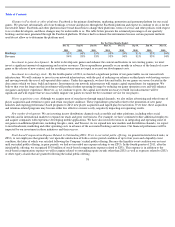
For the Three Months Ended:
Dec 31,
2011
Sep 30,
2011
Jun 30,
2011
Mar 31,
2011
Dec 31,
2010
Sep 30,
2010
Jun 30,
2010
Mar 31,
2010
(as a percentage of revenue)
Consolidated Statements of
Operations Data:
Revenue
100
%
100
%
100
%
100
%
100
%
100
%
100
%
100
%
Costs and expenses:
Cost of revenue
33
26
28
28
26
29
32
33
Research and
development
143
38
34
30
26
23
23
28
Sales and marketing
36
14
14
17
20
17
23
17
General and
administrative
44
12
19
11
(9
)
11
12
16
Total costs and expenses
256
90
95
86
63
80
90
94
Income (loss) from
operations
(156
)%
10
%
5
%
14
%
37
%
20
%
10
%
6
%
Net income (loss)
(140
)%
4
%
0
%
6
%
22
%
16
%
11
%
6
%