Zynga 2011 Annual Report Download - page 41
Download and view the complete annual report
Please find page 41 of the 2011 Zynga annual report below. You can navigate through the pages in the report by either clicking on the pages listed below, or by using the keyword search tool below to find specific information within the annual report.-
 1
1 -
2
-
3
-
4
-
5
-
6
-
7
-
8
-
9
-
10
-
11
-
12
-
13
-
14
-
15
-
16
-
17
-
18
-
19
-
20
-
21
-
22
-
23
-
24
-
25
-
26
-
27
-
28
-
29
-
30
-
 31
31 -
 32
32 -
 33
33 -
 34
34 -
 35
35 -
 36
36 -
 37
37 -
 38
38 -
 39
39 -
 40
40 -
 41
41 -
 42
42 -
 43
43 -
 44
44 -
 45
45 -
 46
46 -
 47
47 -
 48
48 -
 49
49 -
 50
50 -
 51
51 -
52
-
53
-
54
-
55
-
56
-
57
-
58
-
59
-
60
-
61
-
62
-
63
-
64
-
65
-
66
-
67
-
68
-
69
-
70
-
71
-
72
-
73
-
74
-
75
-
76
-
77
-
78
-
79
-
80
-
81
-
82
-
83
-
84
-
85
-
86
-
87
-
88
-
89
-
90
-
91
-
92
-
93
-
94
-
95
-
96
-
97
-
98
-
99
-
100
-
101
-
102
-
103
-
104
 |
 |

Table of Contents
Our operating metrics may not correlate directly to quarterly bookings or revenue trends in the short term. For instance, revenue has grown
every quarter since our inception, including in quarters where DAU, MAU and MUU did not grow.
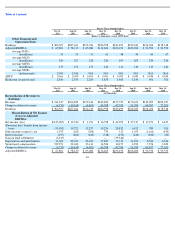
Other Metrics
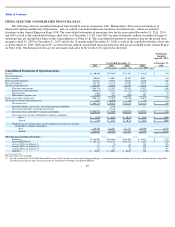
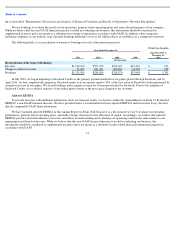
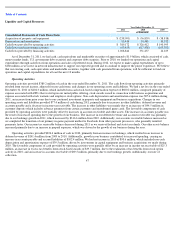
Although certain mobile payer data for the third and fourth quarters of 2011 became available to us in the fourth quarter of 2011, the table
below shows quarterly unique payers excluding mobile payers in all periods presented in order to present a payer metric that excludes mobile
payer data for all periods. The following table presents certain bookings and estimated quarterly unique payer data for the last eight quarters:
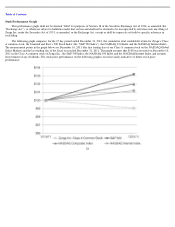
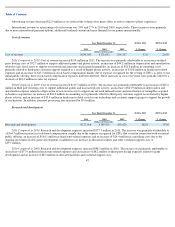
Factors Affecting Our Performance
Launch of new games and release of enhancements . Our bookings and revenue growth have been driven by the launch of new games and
the release of fresh content and new features in existing games. Although the amount of revenue and bookings we generate from a new game or
an enhancement to an existing game can vary significantly, we expect our revenue and bookings growth to be correlated to the success of our
new games and our success in releasing engaging content and features.
Game monetization . We generate most of our bookings and revenue from the sale of virtual goods in our games. The degree to which our
players choose to pay for virtual goods in our games is driven by our ability to create content and virtual goods that enhance the game-play
experience. Our bookings, revenue and overall financial performance are affected by the number of players and the effectiveness of our
monetization of players through the sale of virtual goods and advertising. In addition, international players have historically lagged the
monetization that we achieve for U.S. players, and the percentage of paying international players may increase or decrease based on a number of
factors, including growth in overall international players, localization of content and the availability of payment options.
37
For the Three Months Ended:
Dec 31,
2011
Sep 30,
2011
Jun 30,
2011
Mar 31,
2011
Dec 31,
2010
Sep 30,
2010
Jun 30,
2010
Mar 31,
2010
(in thousands, except per unique payer data)
Bookings
$
306,507
$
287,661
$
274,743
$
286,598
$
243,499
$
222,383
$
194,696
$
178,318
Unique payer bookings (1)
$
257,730
$
247,800
$
233,898
$
254,002
$
214,893
$
197,140
$
176,427
$
164,374
Quarterly unique payers (2)
3,499
3,407
3,336
3,676
3,027
2,754
2,577
2,330
Unique payer bookings per quarterly unique
payer (3)
$
73
$
73
$
70
$
69
$
71
$
72
$
68
$
71
(1) Quarterly unique payer bookings represents the amount of bookings that we received through payment methods for which we can quantify
the number of unique payers and excludes mobile payers for all periods presented. Also excluded are bookings from advertising, and
certain smaller web
-
based payment methods.
(2) Quarterly unique payers represents the aggregate number of unique players who made a payment at least once during the quarter through a
payment method for which we can quantify the number of unique payers. It does not include payers who use mobile platforms and payers
who use certain smaller web-based payment methods. If a player made a payment in our games on two separate platforms (e.g. Facebook
and Google+) in a period, the player would be counted as two unique payers in that period.
(3)
Unique payer bookings per unique payer is calculated by dividing unique payer bookings by quarterly unique payers.