Zynga 2011 Annual Report Download - page 46
Download and view the complete annual report
Please find page 46 of the 2011 Zynga annual report below. You can navigate through the pages in the report by either clicking on the pages listed below, or by using the keyword search tool below to find specific information within the annual report.-
 1
1 -
2
-
3
-
4
-
5
-
6
-
7
-
8
-
9
-
10
-
11
-
12
-
13
-
14
-
15
-
16
-
17
-
18
-
19
-
20
-
21
-
22
-
23
-
24
-
25
-
26
-
27
-
28
-
29
-
30
-
31
-
32
-
33
-
34
-
35
-
 36
36 -
 37
37 -
 38
38 -
 39
39 -
 40
40 -
 41
41 -
 42
42 -
 43
43 -
 44
44 -
 45
45 -
 46
46 -
 47
47 -
 48
48 -
 49
49 -
 50
50 -
 51
51 -
 52
52 -
 53
53 -
 54
54 -
 55
55 -
 56
56 -
57
-
58
-
59
-
60
-
61
-
62
-
63
-
64
-
65
-
66
-
67
-
68
-
69
-
70
-
71
-
72
-
73
-
74
-
75
-
76
-
77
-
78
-
79
-
80
-
81
-
82
-
83
-
84
-
85
-
86
-
87
-
88
-
89
-
90
-
91
-
92
-
93
-
94
-
95
-
96
-
97
-
98
-
99
-
100
-
101
-
102
-
103
-
104
 |
 |

Table of Contents
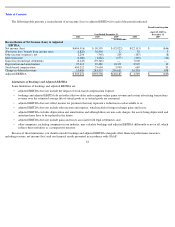
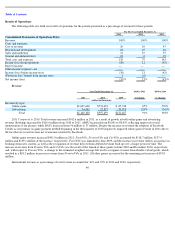
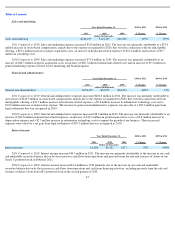
Advertising revenue decreased $12.9 million as we reduced the volume of in-game offers in order to improve player experience.
International revenue as a percentage of total revenue was 33% and 27% in 2010 and 2009, respectively. These increases were primarily
due to more international payment options, additional localized content and more demand for our games internationally.
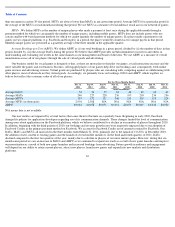
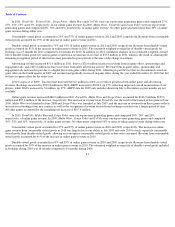
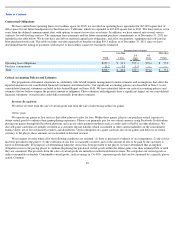
Cost of revenue
2011 Compared to 2010. Cost of revenue increased $154 million in 2011. The increase was primarily attributable to an increase in third
party hosting costs of $72.7 million to support additional games and player activity, an increase of $44.2 million in depreciation and amortization
related to new fixed assets to support our network infrastructure and acquired intangibles, an increase of $18.8 million in consulting costs
primarily related to third-party customer support required as a result of higher player activity, an increase of $10.8 million in headcount-related
expenses and an increase of $15.5 million in stock-
based compensation mainly due to expense recognized for the vesting of ZSUs, as prior to our
initial public offering, these stock-
based compensation expenses had been deferred. These increases in costs of revenue were partially offset by a
decrease of $10.2 million in sales tax expense.
2010 Compared to 2009. Cost of revenue increased $119.3 million in 2010. The increase was primarily attributable to an increase of $47.6
million in third party hosting costs to support additional games and increased player activity, an increase of $23.9 million in depreciation and
amortization expense related to depreciation of new fixed assets to support our network infranstructure and amortization of intangibles acquired
in business acquisitions, an increase of $18.0 million in consulting costs primarily related to third-party customer support necessitated by higher
player activity, and an increase of $13.4 million in headcount-
related costs for our technology and customer support groups to support the growth
of our business. In addition, payment processing fees increased by $9.6 million.
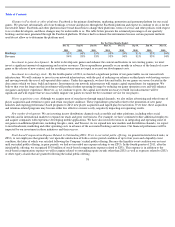
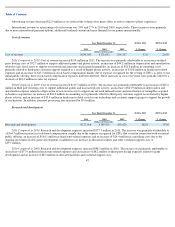
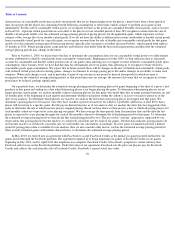
Research and development
2011 Compared to 2010. Research and development expenses increased $577.5 million in 2011. The increase was primarily attributable to
a $364.7 million increase in stock-based compensation, mainly due to the expense recognized for ZSUs that vested in connection with our initial
public offering, an increase of $164.1 million in headcount-related expenses and an increase of $24.4 million in consulting costs due to the
ongoing investment in new game development, in addition to an increase in allocated facilities and other overhead support costs of
$19.7 million.
2010 Compared to 2009. Research and development expenses increased $98.5 million in 2010. The increase was primarily attributable to
an increase of $77.9 million in headcount-related expenses and an increase of $8.2 million in third-party design expenses related to game
development and an increase of $8.9 million in allocated facilities and overhead support costs.
42
Year Ended December 31,
2010 to 2011
% Change
2009 to 2010
% Change
2011
2010
2009
(dollars in thousands)
Cost of revenue
$
330,043
$
176,052
$
56,707
87
%
210
%
Year Ended December 31,
2010 to 2011
% Change
2009 to 2010
% Change
2011
2010
2009
(dollars in thousands)
Research and development
$
727,018
$
149,519
$
51,029
386
%
193
%