Zynga 2011 Annual Report Download - page 83
Download and view the complete annual report
Please find page 83 of the 2011 Zynga annual report below. You can navigate through the pages in the report by either clicking on the pages listed below, or by using the keyword search tool below to find specific information within the annual report.-
 1
1 -
2
-
3
-
4
-
5
-
6
-
7
-
8
-
9
-
10
-
11
-
12
-
13
-
14
-
15
-
16
-
17
-
18
-
19
-
20
-
21
-
22
-
23
-
24
-
25
-
26
-
27
-
28
-
29
-
30
-
31
-
32
-
33
-
34
-
35
-
36
-
37
-
38
-
39
-
40
-
41
-
42
-
43
-
44
-
45
-
46
-
47
-
48
-
49
-
50
-
51
-
52
-
53
-
54
-
55
-
56
-
57
-
58
-
59
-
60
-
61
-
62
-
63
-
64
-
65
-
66
-
67
-
68
-
69
-
70
-
71
-
72
-
 73
73 -
 74
74 -
 75
75 -
 76
76 -
 77
77 -
 78
78 -
 79
79 -
 80
80 -
 81
81 -
 82
82 -
 83
83 -
 84
84 -
 85
85 -
 86
86 -
 87
87 -
 88
88 -
 89
89 -
 90
90 -
 91
91 -
 92
92 -
 93
93 -
94
-
95
-
96
-
97
-
98
-
99
-
100
-
101
-
102
-
103
-
104
 |
 |

Table of Contents
Equity Incentive Plans and Stock-Based Compensation
In 2007 we adopted the 2007 Equity Incentive Plan (the 2007 Plan) for the purpose of granting stock options and ZSUs to employees,
directors and non-
employees. Concurrent with the effectiveness of our initial public offering on December 15, 2011, we adopted the 2011 Equity
Incentive Plan (“the 2011 Plan”), and all remaining common shares reserved for future grant or issuance under the 2007 Plan were added to the
2011 Plan. The 2011 Plan was adopted for purposes of granting stock options and ZSUs to employees, directors and non-employees. The
maximum number of shares of our Class A common stock that may be issued under our 2011 Plan is 42.5 million shares and excludes the
number of shares still available under our 2007 Plan as of the date of our initial public offering in addition to any other stock-based awards
granted under the 2007 Plan that otherwise expire or terminate without having been exercised. The number of shares of our Class A common
stock reserved for future issuance under our 2011 Plan will automatically increase on January 1 of each year, beginning on January 1, 2012, and
continuing through and including January 1, 2021, by 4% of the total number of shares of our capital stock outstanding as of December 31 of the
preceding calendar year.
The 2007 Plan allowed for the early exercise of options, with unvested shares subject to repurchase at the original exercise price by us in
the event of termination of employment with Zynga or termination of service to Zynga in the case of options granted to non-employees.
Repurchased shares were returned to the 2007 Plan. The ability to early exercise was eliminated for grants approved after August 31, 2009.
2.1 million and 18.8 million early exercised shares were subject to repurchase as of December 31, 2011 and 2010, respectively.
In 2011 and 2010, employees early exercised 1.5 million and 0.6 million stock options, respectively. As the shares vest, the related liability
is reclassified into equity. We recorded a liability of $1.5 million, $0.4 million, and $0.2 million for the years ended December 31, 2011, 2010
and 2009, respectively, related to these early exercised options. As of December 31, 2011, 16.4 million shares of Class B common stock, which
were unvested Series Z convertible preferred stock prior to the initial public offering, remained subject to repurchase.
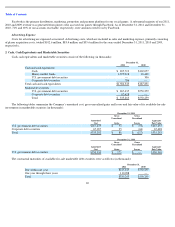
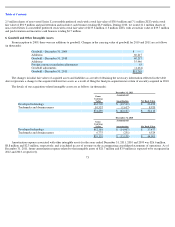
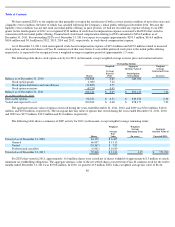
The following table presents the weighted-average assumptions used to estimate the fair values of the stock options granted in our
consolidated financial statements:
For the years ended December 31, 2011, 2010 and 2009, the weighted-average grant date fair value of options granted was $4.17, $4.24,
and $0.33, respectively.
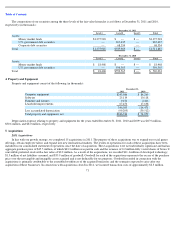
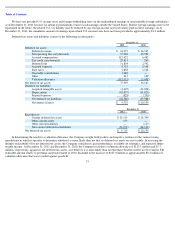
We recorded stock-based compensation expense related to grants of employee and consultant stock options, restricted stock, restricted
stock units, or ZSUs, and vesting Series Z convertible preferred stock in our consolidated statements of operations as follows (in thousands):
79
Year Ended December 31,
2011
2010
2009
Expected term, in years
6
6
6
Risk
-
free interest rates
2.04
%
2.70
%
1.5
–
2.4
%
Expected volatility
64
%
73
%
70
–
77
%
Dividend yield
—
—
—
Fair value of common stock
$
6.44
-
$
17.09
$
6.44
$
0.13
–
$
3.81
Year Ended December 31,
2011
2010
2009
(in thousands)
Cost of revenue
$
17,660
$
2,128
$
443
Research and development
374,920
10,242
1,817
Sales and marketing
81,326
7,899
518
General and administrative
126,306
5,425
1,212
Total stock
-
based compensation
$
600,212
$
25,694
$
3,990