Zynga 2011 Annual Report Download - page 40
Download and view the complete annual report
Please find page 40 of the 2011 Zynga annual report below. You can navigate through the pages in the report by either clicking on the pages listed below, or by using the keyword search tool below to find specific information within the annual report.-
 1
1 -
2
-
3
-
4
-
5
-
6
-
7
-
8
-
9
-
10
-
11
-
12
-
13
-
14
-
15
-
16
-
17
-
18
-
19
-
20
-
21
-
22
-
23
-
24
-
25
-
26
-
27
-
28
-
29
-
 30
30 -
 31
31 -
 32
32 -
 33
33 -
 34
34 -
 35
35 -
 36
36 -
 37
37 -
 38
38 -
 39
39 -
 40
40 -
 41
41 -
 42
42 -
 43
43 -
 44
44 -
 45
45 -
 46
46 -
 47
47 -
 48
48 -
 49
49 -
 50
50 -
51
-
52
-
53
-
54
-
55
-
56
-
57
-
58
-
59
-
60
-
61
-
62
-
63
-
64
-
65
-
66
-
67
-
68
-
69
-
70
-
71
-
72
-
73
-
74
-
75
-
76
-
77
-
78
-
79
-
80
-
81
-
82
-
83
-
84
-
85
-
86
-
87
-
88
-
89
-
90
-
91
-
92
-
93
-
94
-
95
-
96
-
97
-
98
-
99
-
100
-
101
-
102
-
103
-
104
 |
 |

Table of Contents
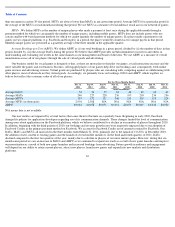
than one game in a given 30-day period, MUUs are always lower than MAUs in any given time period. Average MUUs for a particular period is
the average of the MUUs at each month-end during that period. We use MUU as a measure of total audience reach across our network of games.
MUPs . We define MUPs as the number of unique players who made a payment at least once during the applicable month through a
payment method for which we can quantify the number of unique payers, including mobile payers. MUPs does not include payers who use
certain smaller web-based payment methods for which we cannot quantify the number of unique payers. If a player made a payment in our
games on two separate platforms (e.g. Facebook and Google+) in a period, the player would be counted as two unique payers in that period.
Monthly unique payers are presented as a quarterly average of the three months in the applicable quarter.
Average Bookings per User (ABPU).
We define ABPU as (i) our total bookings in a given period, divided by (ii) the number of days in that
period, divided by, (iii) the average DAUs during the period. We believe that ABPU provides useful information to investors and others in
understanding and evaluating our results in the same manner as our management and board of directors. We use ABPU as a measure of overall
monetization across all of our players through the sale of virtual goods and advertising.
Our business model for social games is designed so that, as there are more players that play our games, social interactions increase and the
more valuable the games and our business becomes. All engaged players of our games help drive our bookings and, consequently, both online
game revenue and advertising revenue. Virtual goods are purchased by players who are socializing with, competing against or collaborating with
other players, most of whom do not buy virtual goods. Accordingly, we primarily focus on bookings, DAUs and ABPU, which together we
believe best reflect the economic value of all of our players.
N/A means data is not available.
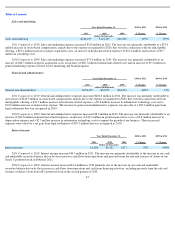
Our user metrics are impacted by several factors that cause them to fluctuate on a quarterly basis. Beginning in early 2010, Facebook
changed its policies for application developers regarding use of its communication channels. These changes limited the level of communication
among users about applications on the Facebook platform, which we believe contributed to a decline in our number of players throughout 2010.
In addition, beginning with the third quarter of 2010, our bookings and revenue growth rates were negatively impacted due to our adoption of
Facebook Credits as the primary payment method on Facebook. We account for Facebook Credits net of amounts retained by Facebook. Our
DAUs, MAUs and MUUs all increased in the three months ended March 31, 2011, primarily due to the launch of CityVille in December 2010,
the addition of new content to existing games and the launch of several mobile initiatives. In the third and fourth quarters of 2011, DAUs
declined compared to the first two quarters of the year, mainly due to a decline in players of our more mature games. However, during that six-
month same period we saw an increase in MAUs and ABPU as we continued to expand our reach as a result of new game launches and improve
our monetization as a result of both new game launches and increased bookings from advertising. Future growth in audience and engagement
will depend on our ability to retain current players, attract new players, launch new games and expand into new markets and distribution
platforms.
36
For the Three Months Ended
Dec 31,
2011
Sep 30,
2011
Jun 30,
2011
Mar 31,
2011
Dec 31,
2010
Sep 30,
2010
Jun 30,
2010
Mar 31,
2010
(users in millions)
Average DAUs
54
54
59
62
48
49
60
67
Average MAUs
240
227
228
236
195
203
234
236
Average MUUs
153
152
151
146
111
110
119
124
Average MUPs (in thousands)
2,901
2,568
N/A
N/A
N/A
N/A
N/A
N/A
ABPU
$
0.061
$
0.058
$
0.051
$
0.051
$
0.055
$
0.049
$
0.036
$
0.030