Zynga 2011 Annual Report Download - page 51
Download and view the complete annual report
Please find page 51 of the 2011 Zynga annual report below. You can navigate through the pages in the report by either clicking on the pages listed below, or by using the keyword search tool below to find specific information within the annual report.-
 1
1 -
2
-
3
-
4
-
5
-
6
-
7
-
8
-
9
-
10
-
11
-
12
-
13
-
14
-
15
-
16
-
17
-
18
-
19
-
20
-
21
-
22
-
23
-
24
-
25
-
26
-
27
-
28
-
29
-
30
-
31
-
32
-
33
-
34
-
35
-
36
-
37
-
38
-
39
-
40
-
 41
41 -
 42
42 -
 43
43 -
 44
44 -
 45
45 -
 46
46 -
 47
47 -
 48
48 -
 49
49 -
 50
50 -
 51
51 -
 52
52 -
 53
53 -
 54
54 -
 55
55 -
 56
56 -
 57
57 -
 58
58 -
 59
59 -
 60
60 -
 61
61 -
62
-
63
-
64
-
65
-
66
-
67
-
68
-
69
-
70
-
71
-
72
-
73
-
74
-
75
-
76
-
77
-
78
-
79
-
80
-
81
-
82
-
83
-
84
-
85
-
86
-
87
-
88
-
89
-
90
-
91
-
92
-
93
-
94
-
95
-
96
-
97
-
98
-
99
-
100
-
101
-
102
-
103
-
104
 |
 |

Table of Contents
Liquidity and Capital Resources
As of December 31, 2011, we had cash, cash equivalents and marketable securities of approximately $1.9 billion, which consisted of cash,
money market funds, U.S. government debt securities and corporate debt securities. Prior to 2010, we funded our operations and capital
expenditures through cash flows from operations and sales of preferred stock. During 2012, we expect to make capital expenditures of up to
$160 million as we invest in network infrastructure to support our expected growth and to continue to improve the player experience. We believe
that our existing cash, cash equivalents and marketable securities, together with cash generated from operations, will be sufficient to fund our
operations and capital expenditures for at least the next 12 months.
Operating Activities
Operating activities provided $389.2 million of cash in the year ended December 31, 2011. The cash flow from operating activities primarily
resulted from our net income, adjusted for non-
cash items, and changes in our operating assets and liabilities. We had a net loss in the year ended
December 31, 2011 of $404.3 million, which included non-cash stock-based compensation expense of $600.2 million, composed primarily of
expense associated with ZSUs that vested upon our initial public offering, stock awards issued in connection with business acquisitions and
expense associated with stock warrants and employee stock options. Non-cash depreciation and amortization expense was $95.4 million during
2011, an increase from prior years due to our continued investment in property and equipment and business acquisitions. Changes in our
operating assets and liabilities provided $77.4 million of cash during 2011, primarily due to increases in other liabilities, deferred revenue and
accounts payable and a decrease in income tax receivable. The increase in other liabilities was mainly due to an increase of $44.5 million in
customer deposits which includes advance payments from certain customers and unredeemed game cards. The favorable components of cash
provided by operating activities were partially offset by increases in accounts receivable and other assets. The increases in accounts payable was
the result of increased spending due to the growth of our business. The increase in our deferred revenue and accounts receivable was primarily
due to our bookings growth in 2011, which increased by $316.6 million from 2010. Additionally, our accounts receivable balance increased as
we completed the transition of our primary in-game payment method to Facebook from other payment processors, who generally remitted
payments faster. Our income tax receivable balance decreased during 2011 as we received federal and state tax refunds. Our other assets balance
increased primarily due to an increase in prepaid expenses, which was driven by the growth of our business during the year.
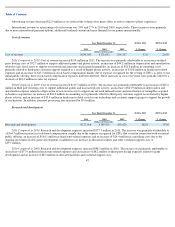
Operating activities provided $326.4 million of cash in 2010, primarily from an increase in bookings, which resulted in an increase in
deferred revenue of $241.4 million from 2009 to 2010. Additionally, growth in our business contributed to increased spending, causing an
increase in accounts payable and accrued liabilities of $102.4 million. We had net income in 2010 of $90.6 million, which included non-cash
depreciation and amortization expense of $39.5 million, driven by investments in capital equipment and business acquisitions we made during
2010. The favorable components of cash provided by operating activities were partially offset by an increase in income tax receivable of $25.3
million, an increase in excess tax benefits from stock-based awards of $39.7 million, due to the realization of tax benefits from stock option
activity in 2010; and an increase in accounts receivable of $69.5 million, primarily due to our bookings growth. Additionally, our rate of
collection
47
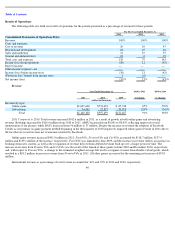
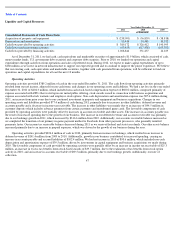
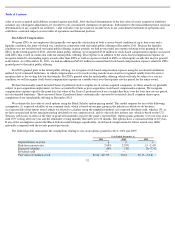
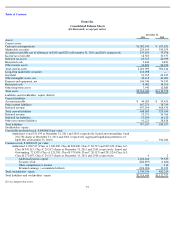
Year Ended December 31,
2011
2010
2009
(in thousands)
Consolidated Statements of Cash Flows Data:
Acquisition of property and equipment
$
(238,091
)
$
(56,839
)
$
(38,818
)
Depreciation and amortization
95,414
39,481
10,372
Cash flows provided by operating activities
$
389,172
$
326,412
$
190,995
Cash flows used in investing activities
(63,455
)
(617,438
)
(103,392
)
Cash flows provided by financing activities
1,068,844
351,437
14,169