Zynga 2011 Annual Report Download - page 44
Download and view the complete annual report
Please find page 44 of the 2011 Zynga annual report below. You can navigate through the pages in the report by either clicking on the pages listed below, or by using the keyword search tool below to find specific information within the annual report.-
 1
1 -
2
-
3
-
4
-
5
-
6
-
7
-
8
-
9
-
10
-
11
-
12
-
13
-
14
-
15
-
16
-
17
-
18
-
19
-
20
-
21
-
22
-
23
-
24
-
25
-
26
-
27
-
28
-
29
-
30
-
31
-
32
-
33
-
 34
34 -
 35
35 -
 36
36 -
 37
37 -
 38
38 -
 39
39 -
 40
40 -
 41
41 -
 42
42 -
 43
43 -
 44
44 -
 45
45 -
 46
46 -
 47
47 -
 48
48 -
 49
49 -
 50
50 -
 51
51 -
 52
52 -
 53
53 -
 54
54 -
55
-
56
-
57
-
58
-
59
-
60
-
61
-
62
-
63
-
64
-
65
-
66
-
67
-
68
-
69
-
70
-
71
-
72
-
73
-
74
-
75
-
76
-
77
-
78
-
79
-
80
-
81
-
82
-
83
-
84
-
85
-
86
-
87
-
88
-
89
-
90
-
91
-
92
-
93
-
94
-
95
-
96
-
97
-
98
-
99
-
100
-
101
-
102
-
103
-
104
 |
 |

Table of Contents
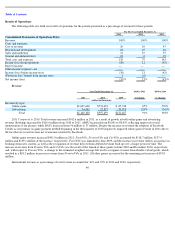
Results of Operations
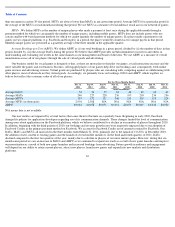
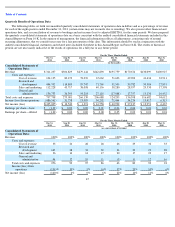
The following table sets forth our results of operations for the periods presented as a percentage of revenue for those periods.
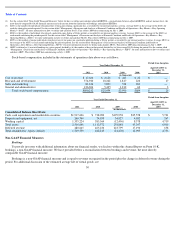
Revenue
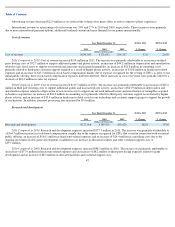
2011 Compared to 2010. Total revenue increased $542.6 million in 2011, as a result of growth in both online game and advertising
revenue. Bookings increased by $316.6 million from 2010 to 2011. ABPU increased from $0.041 to $0.055, reflecting improved overall
monetization of our players, while DAUs increased from 56 million to 57 million. Despite the increase in revenue the adoption of Facebook
Credits as our primary in-game payment method beginning in the third quarter of 2010 negatively impacted online game revenue in 2011 due to
the fact that we record revenue net of amounts retained by Facebook.
Online game revenue increased $491.0 million in 2011. FarmVille, FrontierVille and CityVille accounted for $118.7 million, $137.4
million and $139.1 million of the increase, respectively. FarmVille
was launched in June 2009, and the increase in revenue reflects an increase in
bookings from new content, as well as the recognition of revenue derived from deferred revenue built up over a longer period of time. The
increase in revenue from FrontierVille and CityVille was the result of the launch of these games in June 2010 and December 2010, respectively,
and, with respect to FrontierVille , a change in the estimated weighted-average life used to recognize revenue from durable virtual goods, which
resulted in a $18.2 million increase in revenue from FrontierVille in 2011. All other games accounted for the remaining net increase of $95.8
million .
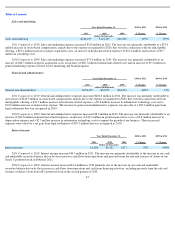
International revenue as a percentage of total revenue accounted for 36% and 33% in 2011 and 2010, respectively.
40
For The Year Ended December 31,
2011
2010
2009
Consolidated Statements of Operations Data:
Revenue
100
%
100
%
100
%
Costs and expenses:
Cost of revenue
29
29
47
Research and development
64
25
42
Sales and marketing
21
19
35
General and administrative
22
6
19
Total costs and expenses
136
79
143
Income (loss) from operations
(36
)
21
(43
)
Interest income
—
—
—
Other income (expense), net
—
—
—
Income (loss) before income taxes
(36
)
21
(43
)
(Provision for) / benefit from income taxes
1
(6
)
—
Net income (loss)
(35
)%
15
%
(43
)%
Year Ended December 31,
2010 to 2011
% Change
2009 to 2010
% Change
2011
2010
2009
(dollars in thousands)
Revenue by type:
Online game
$
1,065,648
$
574,632
$
85,748
85
%
570
%
Advertising
74,452
22,827
35,719
226
%
(36
)%
Total
$
1,140,100
$
597,459
$
121,467
91
%
392
%