Zynga 2011 Annual Report Download - page 34
Download and view the complete annual report
Please find page 34 of the 2011 Zynga annual report below. You can navigate through the pages in the report by either clicking on the pages listed below, or by using the keyword search tool below to find specific information within the annual report.-
 1
1 -
2
-
3
-
4
-
5
-
6
-
7
-
8
-
9
-
10
-
11
-
12
-
13
-
14
-
15
-
16
-
17
-
18
-
19
-
20
-
21
-
22
-
23
-
 24
24 -
 25
25 -
 26
26 -
 27
27 -
 28
28 -
 29
29 -
 30
30 -
 31
31 -
 32
32 -
 33
33 -
 34
34 -
 35
35 -
 36
36 -
 37
37 -
 38
38 -
 39
39 -
 40
40 -
 41
41 -
 42
42 -
 43
43 -
 44
44 -
45
-
46
-
47
-
48
-
49
-
50
-
51
-
52
-
53
-
54
-
55
-
56
-
57
-
58
-
59
-
60
-
61
-
62
-
63
-
64
-
65
-
66
-
67
-
68
-
69
-
70
-
71
-
72
-
73
-
74
-
75
-
76
-
77
-
78
-
79
-
80
-
81
-
82
-
83
-
84
-
85
-
86
-
87
-
88
-
89
-
90
-
91
-
92
-
93
-
94
-
95
-
96
-
97
-
98
-
99
-
100
-
101
-
102
-
103
-
104
 |
 |

Table of Contents
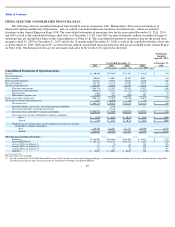
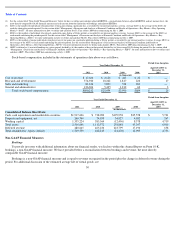
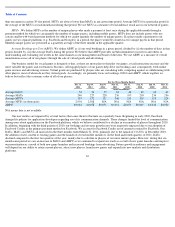
Stock-based compensation included in the statements of operations data above was as follows:
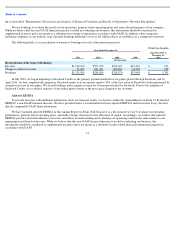
Non-GAAP Financial Measures
Bookings
To provide investors with additional information about our financial results, we disclose within this Annual Report on Form 10-K,
bookings, a non-GAAP financial measure. We have provided below a reconciliation between bookings and revenue, the most directly
comparable GAAP financial measure.
Bookings is a non-
GAAP financial measure and is equal to revenue recognized in the period plus the change in deferred revenue during the
period. For additional discussion of the estimated average life of virtual goods, see
30
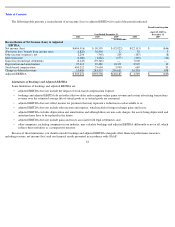
(2) See the section titled “Non-GAAP Financial Measures” below for how we define and calculate adjusted EBITDA, a reconciliation between adjusted EBITDA and net income (loss), the
most directly comparable GAAP financial measure and a discussion about the limitations of bookings and adjusted EBITDA.
(3) DAUs is the number of individuals who played one of our games during a particular day, as recorded by our internal analytics systems. Average DAUs is the average of the DAUs for
each day during the period reported. See the section titled “Management’s Discussion and Analysis of Financial Condition and Results of Operations—Key Metrics—Key Operating
Metrics
—
DAUs
”
for more information on how we define and calculate DAUs. This reflects 2009 data commencing on July 1, 2009.
(4) MAUs is the number of individuals who played a particular game during a 30-day-period, as recorded by our internal analytics systems. Average MAUs is the average of the MAUs at
each month-end during the period reported. See the section titled “Management’s Discussion and Analysis of Financial Condition and Results of Operations—Key Metrics—Key
Operating Metrics
—
MAUs
”
for more information on how we define and calculate MAUs. This reflects 2009 data commencing on July 1, 2009.
(5) MUUs is the number of unique individuals who played any of our games on a particular platform during a 30-
day period, as recorded by our internal analytics systems. Average MUUs is
the average of the MUUs at each month-end during the period reported. See the section titled “Management’s Discussion and Analysis of Financial Condition and Results of
Operations
—
Key Metrics
—
Key Operating Metrics
—
MUUs
”
for more information on how we define and calculate MUUs. This reflects 2009 data commencing on July 1, 2009.
(6) ABPU is defined as (i) our total bookings in a given period, divided by (ii) the number of days in that period, divided by (iii) the average DAUs during the period. See the section titled
“Management’s Discussion and Analysis of Financial Condition and Results of Operations—Key Metrics—Key Operating Metrics—ABPU” for more information on how we define and
calculate ABPU. This reflects 2009 data commencing on July 1, 2009.
Year Ended December 31,
Period from Inception
(April 29, 2007) to
December 31,
2007
2011
2010
2009
2008
(in thousands)
Cost of revenue
$
17,660
$
2,128
$
443
$
22
$
—
Research and development
374,920
10,242
1,817
226
17
Sales and marketing
81,326
7,899
518
381
—
General and administrative
126,306
5,425
1,212
60
3
Total stock
-
based compensation
$
600,212
$
25,694
$
3,990
$
689
$
20
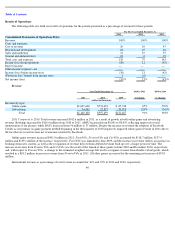
Year Ended December 31,
Period from Inception
(April 19, 2007) to
December 31,
2007
2011
2010
2009
2008
(in thousands)
Consolidated Balance Sheet Data:
Cash, cash equivalents and marketable securities
$
1,917,606
$
738,090
$
199,958
$
35,558
$
5,731
Property and equipment, net
246,740
74,959
34,827
4,052
267
Working capital
1,355,224
385,564
(12,496
)
8,378
4,719
Total assets
2,516,646
1,112,572
258,848
45,367
6,016
Deferred revenue
480,645
465,236
223,799
17,196
658
Total stockholders
’
equity (deficit)
1,749,539
482,215
(21,478
)
12,995
4,756