Zynga 2011 Annual Report Download - page 52
Download and view the complete annual report
Please find page 52 of the 2011 Zynga annual report below. You can navigate through the pages in the report by either clicking on the pages listed below, or by using the keyword search tool below to find specific information within the annual report.-
 1
1 -
2
-
3
-
4
-
5
-
6
-
7
-
8
-
9
-
10
-
11
-
12
-
13
-
14
-
15
-
16
-
17
-
18
-
19
-
20
-
21
-
22
-
23
-
24
-
25
-
26
-
27
-
28
-
29
-
30
-
31
-
32
-
33
-
34
-
35
-
36
-
37
-
38
-
39
-
40
-
41
-
 42
42 -
 43
43 -
 44
44 -
 45
45 -
 46
46 -
 47
47 -
 48
48 -
 49
49 -
 50
50 -
 51
51 -
 52
52 -
 53
53 -
 54
54 -
 55
55 -
 56
56 -
 57
57 -
 58
58 -
 59
59 -
 60
60 -
 61
61 -
 62
62 -
63
-
64
-
65
-
66
-
67
-
68
-
69
-
70
-
71
-
72
-
73
-
74
-
75
-
76
-
77
-
78
-
79
-
80
-
81
-
82
-
83
-
84
-
85
-
86
-
87
-
88
-
89
-
90
-
91
-
92
-
93
-
94
-
95
-
96
-
97
-
98
-
99
-
100
-
101
-
102
-
103
-
104
 |
 |

Table of Contents
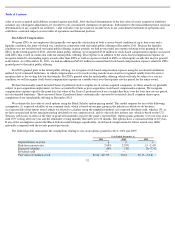
on accounts receivable was impacted in the second half of the year, as we began transitioning our primary in-
game payment method to Facebook
from other payment processors, who generally remit payments faster.
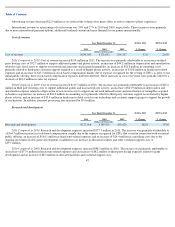
Operating activities provided $191.0 million of cash in 2009. The cash flow from operating activities primarily resulted from an increase in
bookings, which resulted in an increase in deferred revenue of $206.6 million from 2008 to 2009. The growth of our business also resulted in
increased spending, causing an increase in accounts payable and accrued liabilities of $40.5 million. The favorable components of cash provided
by operating activities were partially offset by our net loss in 2009 of $52.8 million and increases in income tax receivable and accounts
receivable. The increase in income tax receivable was due to tax payments made in excess of taxes due for 2009 and the increase in accounts
receivable was due to the increase in bookings.
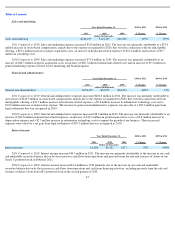
Investing Activities
Our primary investing activities have consisted of purchases and sales of marketable securities, purchases of property and equipment and
business acquisitions.
Cash used in the purchase of marketable securities was $650.0 million in 2011, $804.5 million in 2010 and $125.1 million in 2009. Cash
provided by the sale and maturity of marketable securities was $860.8 million in 2011, $324.0 million in 2010 and $62.4 million in 2009. We
used $42.8 million, $62.3 million and $0.5 million, net of cash acquired, in connection with acquisitions in 2011, 2010 and 2009, respectively.
Our purchases of property and equipment have primarily related to our investment in our data centers. We also continued to invest in
technology hardware and software to support our growth. Purchases of property and equipment may vary from period to period due to the timing
of the expansion of our operations and game and software development. We expect to continue to invest in property and equipment and
development of software associated with online games in 2012 and thereafter.
Financing Activities
Our financing activities have consisted primarily of net proceeds from the issuance of our common stock and preferred stock, repurchases
of common stock and preferred stock and taxes paid related to the net settlement of equity awards.
In 2011, we issued 100.0 million shares of Class A common stock and 34.9 million shares of Series C preferred stock for net proceeds of
$961.4 million and $485.3 million, respectively. We repurchased 27.5 million shares of our outstanding capital stock for a total purchase price of
$283.8 million and made payments of $83.2 million related to tax withholding obligations and the related net settlement of equity awards during
2011.
Credit Facility
In July 2011, we executed a revolving credit agreement with certain lenders to borrow up to $1.0 billion in revolving loans. Per the terms
of the credit agreement, we paid upfront fees of $2.5 million and we are required to pay ongoing commitment fees of up to $625,000 each
quarter based on the portion of the credit facility that is not drawn down. The interest rate for the credit facility is determined based on a formula
using certain market rates. As of December 31, 2011, we had not drawn down any amounts on the credit facility.
Off–Balance Sheet Arrangements
We did not have any off-balance sheet arrangements in 2011, 2010 and 2009.
48