Zynga 2011 Annual Report Download - page 36
Download and view the complete annual report
Please find page 36 of the 2011 Zynga annual report below. You can navigate through the pages in the report by either clicking on the pages listed below, or by using the keyword search tool below to find specific information within the annual report.-
 1
1 -
2
-
3
-
4
-
5
-
6
-
7
-
8
-
9
-
10
-
11
-
12
-
13
-
14
-
15
-
16
-
17
-
18
-
19
-
20
-
21
-
22
-
23
-
24
-
25
-
 26
26 -
 27
27 -
 28
28 -
 29
29 -
 30
30 -
 31
31 -
 32
32 -
 33
33 -
 34
34 -
 35
35 -
 36
36 -
 37
37 -
 38
38 -
 39
39 -
 40
40 -
 41
41 -
 42
42 -
 43
43 -
 44
44 -
 45
45 -
 46
46 -
47
-
48
-
49
-
50
-
51
-
52
-
53
-
54
-
55
-
56
-
57
-
58
-
59
-
60
-
61
-
62
-
63
-
64
-
65
-
66
-
67
-
68
-
69
-
70
-
71
-
72
-
73
-
74
-
75
-
76
-
77
-
78
-
79
-
80
-
81
-
82
-
83
-
84
-
85
-
86
-
87
-
88
-
89
-
90
-
91
-
92
-
93
-
94
-
95
-
96
-
97
-
98
-
99
-
100
-
101
-
102
-
103
-
104
 |
 |

Table of Contents
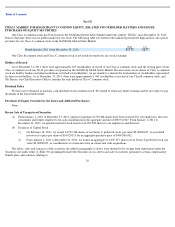
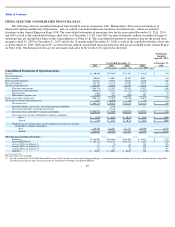
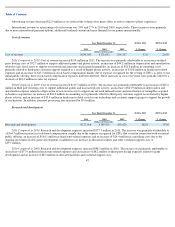
The following table presents a reconciliation of net income (loss) to adjusted EBITDA for each of the periods indicated:
Limitations of Bookings and Adjusted EBITDA
Some limitations of bookings and adjusted EBITDA are:
Because of these limitations, you should consider bookings and adjusted EBITDA alongside other financial performance measures,
including revenue, net income (loss) and our financial results presented in accordance with GAAP.
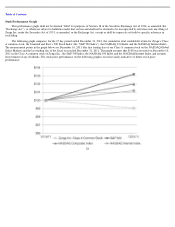
32
Year Ended December 31,
Period from Inception
(April 19, 2007) to
December 31,
2011
2010
2009
2008
2007
(in thousands)
Reconciliation of Net Income (Loss) to Adjusted
EBITDA:
Net income (loss)
$
(404,316
)
$
90,595
$
(52,822
)
$
(22,115
)
$
(846
)
(Provision for) / benefit from income taxes
(1,826
)
36,464
12
38
3
Other income (expense), net
2,206
(365
)
209
(187
)
(8
)
Interest income
(1,680
)
(1,222
)
(177
)
(319
)
(22
)
Gain (loss) from legal settlements
(2,145
)
(39,346
)
—
7,000
—
Depreciation and amortization
95,414
39,481
10,372
2,905
10
Stock
-
based compensation
600,212
25,694
3,990
689
20
Change in deferred revenue
15,409
241,437
206,603
16,538
658
Adjusted EBITDA
$
303,274
$
392,738
$
168,187
$
4,549
$
(185
)
•
adjusted EBITDA does not include the impact of stock
-
based compensation expense;
•
bookings and adjusted EBITDA do not reflect that we defer and recognize online game revenue and certain advertising transactions
revenue over the estimated average life of virtual goods or as virtual goods are consumed;
•
adjusted EBITDA does not reflect income tax payments that may represent a reduction in cash available to us;
•
adjusted EBITDA does not include other income and expense, which includes foreign exchange gains and losses;
•
adjusted EBITDA excludes depreciation and amortization and although these are non-cash charges, the assets being depreciated and
amortized may have to be replaced in the future;
•
adjusted EBITDA does not include gains and losses associated with legal settlements; and
•
other companies, including companies in our industry, may calculate bookings and adjusted EBITDA differently or not at all, which
reduces their usefulness as a comparative measure.