Zynga 2011 Annual Report Download - page 33
Download and view the complete annual report
Please find page 33 of the 2011 Zynga annual report below. You can navigate through the pages in the report by either clicking on the pages listed below, or by using the keyword search tool below to find specific information within the annual report.-
 1
1 -
2
-
3
-
4
-
5
-
6
-
7
-
8
-
9
-
10
-
11
-
12
-
13
-
14
-
15
-
16
-
17
-
18
-
19
-
20
-
21
-
22
-
 23
23 -
 24
24 -
 25
25 -
 26
26 -
 27
27 -
 28
28 -
 29
29 -
 30
30 -
 31
31 -
 32
32 -
 33
33 -
 34
34 -
 35
35 -
 36
36 -
 37
37 -
 38
38 -
 39
39 -
 40
40 -
 41
41 -
 42
42 -
 43
43 -
44
-
45
-
46
-
47
-
48
-
49
-
50
-
51
-
52
-
53
-
54
-
55
-
56
-
57
-
58
-
59
-
60
-
61
-
62
-
63
-
64
-
65
-
66
-
67
-
68
-
69
-
70
-
71
-
72
-
73
-
74
-
75
-
76
-
77
-
78
-
79
-
80
-
81
-
82
-
83
-
84
-
85
-
86
-
87
-
88
-
89
-
90
-
91
-
92
-
93
-
94
-
95
-
96
-
97
-
98
-
99
-
100
-
101
-
102
-
103
-
104
 |
 |

Table of Contents
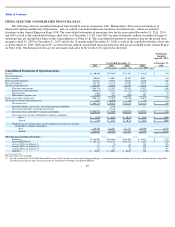
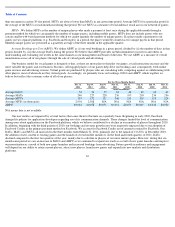
ITEM 6. SELECTED CONSOLIDATED FINANCIAL DATA
The following selected consolidated financial data should be read in conjunction with “Management’s Discussion and Analysis of
Financial Condition and Results of Operations” and our audited consolidated financial statements and related notes, which are included
elsewhere in this Annual Report on Form 10-K. The consolidated statements of operations data for the years ended December 31, 2011, 2010
and 2009 as well as the consolidated balance sheet data as of December 31, 2011 and 2010 are derived from the audited consolidated financial
statements that are included elsewhere in this Annual Report on Form 10-K. The consolidated statement of operations data for the period from
inception (April 19, 2007) to December 31, 2007 and for the 12 months ended December 31, 2008, as well as the consolidated balance sheet data
as of December 31, 2009, 2008 and 2007, are derived from audited consolidated financial statements that are not included in this Annual Report
on Form 10-K. Our historical results are not necessarily indicative of the results to be expected in the future.
NA means data is not available.
29
Year Ended December 31,
Period from
Inception
(April 19, 2007)
to December 31,
2011
2010
2009
2008
2007
(in thousands, except per share, users and ABPU data)
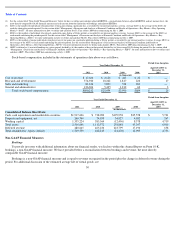
Consolidated Statements of Operations Data:
Revenue
$
1,140,100
$
597,459
$
121,467
$
19,410
$
693
Costs and expenses:
Cost of revenue
330,043
176,052
56,707
10,017
189
Research and development
727,018
149,519
51,029
12,160
869
Sales and marketing
234,199
114,165
42,266
10,982
231
General and administrative
254,456
32,251
24,243
8,834
277
Total costs and expenses
1,545,716
471,987
174,245
41,993
1,566
Income (loss) from operations
(405,616
)
125,472
(52,778
)
(22,583
)
(873
)
Interest income
1,680
1,222
177
319
22
Other income (expense), net
(2,206
)
365
(209
)
187
8
Income (loss) before income taxes
(406,142
)
127,059
(52,810
)
(22,077
)
(843
)
(Provision for) / benefit from income taxes
1,826
(36,464
)
(12
)
(38
)
(3
)
Net income (loss)
$
(404,316
)
$
90,595
$
(52,822
)
$
(22,115
)
$
(846
)
Deemed dividend to a Series B
-
2 convertible preferred stockholder
—
4,590
—
—
—
Net income attributable to participating securities
—
58,110
—
—
—
Net income (loss) attributable to common stockholders
$
(404,316
)
$
27,895
$
(52,822
)
$
(22,115
)
$
(846
)
Net income (loss) per share attributable to common stockholders:
Basic
$
(1.40
)
$
0.12
$
(0.31
)
$
(0.18
)
$
(0.06
)
Diluted
$
(1.40
)
$
0.11
$
(0.31
)
$
(0.18
)
$
(0.06
)
Weighted average common shares used to compute net income (loss) per share
attributable to common stockholders:
Basic
288,599
223,881
171,751
119,990
14,255
Diluted
288,599
329,256
171,751
119,990
14,255
Other Financial and Operational Data:
Bookings(1)
$
1,155,509
$
838,896
$
328,070
$
35,948
$
1,351
Adjusted EBITDA(2)
$
303,274
$
392,738
$
168,187
$
4,549
$
(185
)
Average DAUs (in millions)(3)
57
56
41
NA
NA
Average MAUs (in millions)(4)
233
217
153
NA
NA
Average MUUs (in millions)(5)
151
116
86
NA
NA
ABPU(6)
$
0.055
$
0.041
$
0.035
NA
NA
(1) See the section titled “Non-GAAP Financial Measures” below for how we define and calculate bookings, a reconciliation between bookings and revenue, the most directly comparable
GAAP financial measure and a discussion about the limitations of bookings and adjusted EBITDA.