Zynga 2011 Annual Report Download - page 78
Download and view the complete annual report
Please find page 78 of the 2011 Zynga annual report below. You can navigate through the pages in the report by either clicking on the pages listed below, or by using the keyword search tool below to find specific information within the annual report.-
 1
1 -
2
-
3
-
4
-
5
-
6
-
7
-
8
-
9
-
10
-
11
-
12
-
13
-
14
-
15
-
16
-
17
-
18
-
19
-
20
-
21
-
22
-
23
-
24
-
25
-
26
-
27
-
28
-
29
-
30
-
31
-
32
-
33
-
34
-
35
-
36
-
37
-
38
-
39
-
40
-
41
-
42
-
43
-
44
-
45
-
46
-
47
-
48
-
49
-
50
-
51
-
52
-
53
-
54
-
55
-
56
-
57
-
58
-
59
-
60
-
61
-
62
-
63
-
64
-
65
-
66
-
67
-
 68
68 -
 69
69 -
 70
70 -
 71
71 -
 72
72 -
 73
73 -
 74
74 -
 75
75 -
 76
76 -
 77
77 -
 78
78 -
 79
79 -
 80
80 -
 81
81 -
 82
82 -
 83
83 -
 84
84 -
 85
85 -
 86
86 -
 87
87 -
 88
88 -
89
-
90
-
91
-
92
-
93
-
94
-
95
-
96
-
97
-
98
-
99
-
100
-
101
-
102
-
103
-
104
 |
 |

Table of Contents
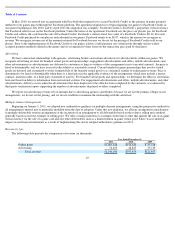
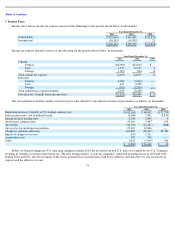
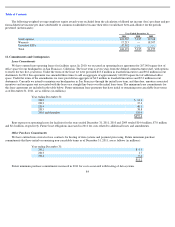
7. Income Taxes
Income (loss) before income tax expense consists of the following for the periods shown below (in thousands):
Income tax expense (benefit) consists of the following for the periods shown below (in thousands):
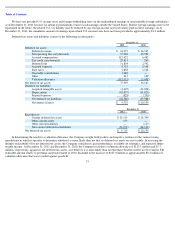
The reconciliation of federal statutory income tax provision (benefit) to our effective income tax provision is as follows (in thousands):
Before we began forming non-U.S. operating companies during 2010, the revenue from non-U.S. users was earned by our U.S. Company,
resulting in virtually no foreign profit before tax. The new foreign entities, as start-up companies, generated operating losses in 2010 and 2011.
During 2010 and 2011, the net tax impact of the losses generated in tax jurisdictions with lower statutory rates than the U.S. rate increased tax
expense and the effective tax rate.
74
Year Ended December 31,
2011
2010
2009
United States
$
(379,800
)
$
141,401
$
(52,831
)
International
(26,342
)
(14,342
)
21
$
(406,142
)
$
127,059
$
(52,810
)
Year Ended December 31,
2011
2010
2009
Current:
Federal
$
(8,990
)
$
34,092
$
—
State
1,195
10,537
1
Foreign
1,600
304
11
Total current tax expense
(6,195
)
44,933
12
Deferred:
Federal
4,689
(9,264
)
—
State
441
2,209
—
Foreign
(761
)
(1,414
)
—
Total deferred tax expense/(benefit)
4,369
(8,469
)
—
Provision for / (benefit from) income taxes
$
(1,826
)
$
36,464
$
12
Year Ended December 31,
2011
2010
2009
Expected provision / (benefit) at U.S. federal statutory rate
$
(142,166
)
$
44,452
$
(17,790
)
State income taxes
-
net of federal benefit
(6,340
)
7,841
(5,859
)
Income taxed at foreign rates
6,338
3,894
4
Stock
-
based compensation
43,064
5,447
659
Tax credits
(34,769
)
(14,231
)
(888
)
Tax reserve for uncertain tax positions
29,303
12,846
—
Change in valuation allowance
101,489
(28,647
)
23,780
Impact of change in tax rates
(205
)
5,211
—
Acquisition costs
397
700
—
Other
1,063
(1,049
)
106
$
(1,826
)
$
36,464
$
12