Zynga 2011 Annual Report Download - page 45
Download and view the complete annual report
Please find page 45 of the 2011 Zynga annual report below. You can navigate through the pages in the report by either clicking on the pages listed below, or by using the keyword search tool below to find specific information within the annual report.-
 1
1 -
2
-
3
-
4
-
5
-
6
-
7
-
8
-
9
-
10
-
11
-
12
-
13
-
14
-
15
-
16
-
17
-
18
-
19
-
20
-
21
-
22
-
23
-
24
-
25
-
26
-
27
-
28
-
29
-
30
-
31
-
32
-
33
-
34
-
 35
35 -
 36
36 -
 37
37 -
 38
38 -
 39
39 -
 40
40 -
 41
41 -
 42
42 -
 43
43 -
 44
44 -
 45
45 -
 46
46 -
 47
47 -
 48
48 -
 49
49 -
 50
50 -
 51
51 -
 52
52 -
 53
53 -
 54
54 -
 55
55 -
56
-
57
-
58
-
59
-
60
-
61
-
62
-
63
-
64
-
65
-
66
-
67
-
68
-
69
-
70
-
71
-
72
-
73
-
74
-
75
-
76
-
77
-
78
-
79
-
80
-
81
-
82
-
83
-
84
-
85
-
86
-
87
-
88
-
89
-
90
-
91
-
92
-
93
-
94
-
95
-
96
-
97
-
98
-
99
-
100
-
101
-
102
-
103
-
104
 |
 |

Table of Contents
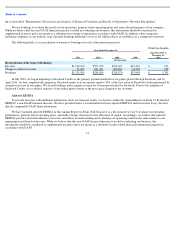
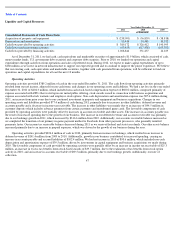
In 2011, FarmVille , FrontierVille , Zynga Poker , Mafia Wars and CityVille were our top revenue-generating games and comprised 27%,
15%, 15%, 13% and 13%, respectively, of our online game revenue. In 2010, Mafia Wars , FarmVille and Zynga Poker were our top revenue-
generating games and comprised 28%, 30% and 20%, respectively, of online game revenue. No other game generated more than 10% of online
game revenue during either year.
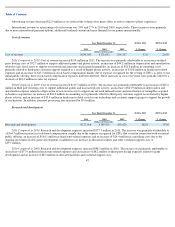
Consumable virtual goods accounted for 29% and 37% of online game revenue in 2011 and 2010, respectively. Revenue from consumable
virtual goods accounted for 19% of the increase in online game revenue in 2011.
Durable virtual goods accounted for 71% and 63% of online game revenue in 2011 and 2010, respectively. Revenue from durable virtual
goods accounted for 81% of the increase in online game revenue in 2011. The estimated weighted-average life of durable virtual goods for
bookings was 15 months for 2011 compared to 18 months for 2010. In addition, in 2011 cumulative changes in our estimated weighted-average
life of durable virtual goods for various games resulted in a net increase in revenue of $53.9 million in 2011, which is the result of adjusting the
remaining recognition period of deferred revenue generated in prior periods at the time of the change in estimate.
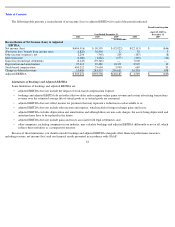
Advertising revenue increased $51.6 million in 2011, due to a $26.0 million increase in revenue from in-game offers, sponsorships and
engagement ads, and a $25.6 million increase in revenue from other advertising activity. Revenue from in-game offers, sponsorships and
engagement ads increased in part due to a higher level of in-game offers during 2011, reflecting in part the fact that we discontinued certain in-
game offers in the fourth quarter of 2009 and resumed and gradually increased in-game offers during the year ended December 31, 2010 but did
not have in-game offers for the entire year.
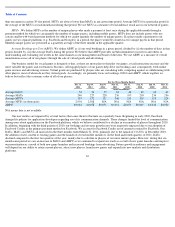
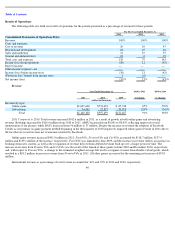
2010 Compared to 2009 . Total revenue increased $476.0 million in 2010, as a result of growth in both online game and advertising
revenues. Bookings increased by $510.8 million in 2010. ABPU increased to $0.041, up 17%, reflecting improved overall monetization of our
players, while DAUs increased to 56 million, up 37%. ABPU data for 2009 only includes data from July to December as prior months are not
available.
Online game revenue increased $488.9 million in 2010. FarmVille, Mafia Wars and Zynga Poker accounted for $166.9 million, $129.1
million and $85.1 million of the increase, respectively. The increase in revenue from FarmVille was the result of the launch of this game in June
2009. Mafia Wars was launched in June 2008 and Zynga Poker was
launched in July 2007, and the increase in revenue from these games reflects
an increase in bookings from new content, as well as the recognition of revenue derived from bookings recorded over a longer period of time.
All other games accounted for the remaining net increase of $107.8 million.
In 2010, FarmVille, Mafia Wars and Zynga Poker were our top revenue-generating games and comprised 30%, 28% and 20%,
respectively, of online game revenue. In 2009, Mafia Wars , Zynga Poker and YoVille were our top revenue-generating games and comprised
39%, 32% and 11%, respectively, of online game revenue. No other game comprised 10% or more of online game revenue during either year.
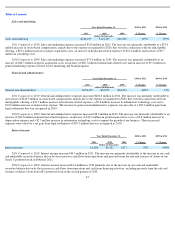
Consumable virtual goods accounted for 37% and 15% of online game revenue in 2010 and 2009, respectively. The increase in online
game revenue from consumable virtual goods in 2010 was largely due to our ability in late 2009 and early 2010 to track separately consumable
virtual goods from durable virtual goods, allowing us to recognize consumable virtual goods as they were consumed. Revenue from consumable
virtual goods accounted for 41% of the increase in online game revenue in 2010.
Durable virtual goods accounted for 63% and 85% of online game revenue in 2010 and 2009, respectively. Revenue from durable virtual
goods accounted for 59% of the increase in online game revenue in 2010. The estimated weighted-average life of durable virtual goods included
in bookings during 2010 was 18 months compared to 19 months during 2009.
41