Zynga 2011 Annual Report Download - page 73
Download and view the complete annual report
Please find page 73 of the 2011 Zynga annual report below. You can navigate through the pages in the report by either clicking on the pages listed below, or by using the keyword search tool below to find specific information within the annual report.-
 1
1 -
2
-
3
-
4
-
5
-
6
-
7
-
8
-
9
-
10
-
11
-
12
-
13
-
14
-
15
-
16
-
17
-
18
-
19
-
20
-
21
-
22
-
23
-
24
-
25
-
26
-
27
-
28
-
29
-
30
-
31
-
32
-
33
-
34
-
35
-
36
-
37
-
38
-
39
-
40
-
41
-
42
-
43
-
44
-
45
-
46
-
47
-
48
-
49
-
50
-
51
-
52
-
53
-
54
-
55
-
56
-
57
-
58
-
59
-
60
-
61
-
62
-
 63
63 -
 64
64 -
 65
65 -
 66
66 -
 67
67 -
 68
68 -
 69
69 -
 70
70 -
 71
71 -
 72
72 -
 73
73 -
 74
74 -
 75
75 -
 76
76 -
 77
77 -
 78
78 -
 79
79 -
 80
80 -
 81
81 -
 82
82 -
 83
83 -
84
-
85
-
86
-
87
-
88
-
89
-
90
-
91
-
92
-
93
-
94
-
95
-
96
-
97
-
98
-
99
-
100
-
101
-
102
-
103
-
104
 |
 |
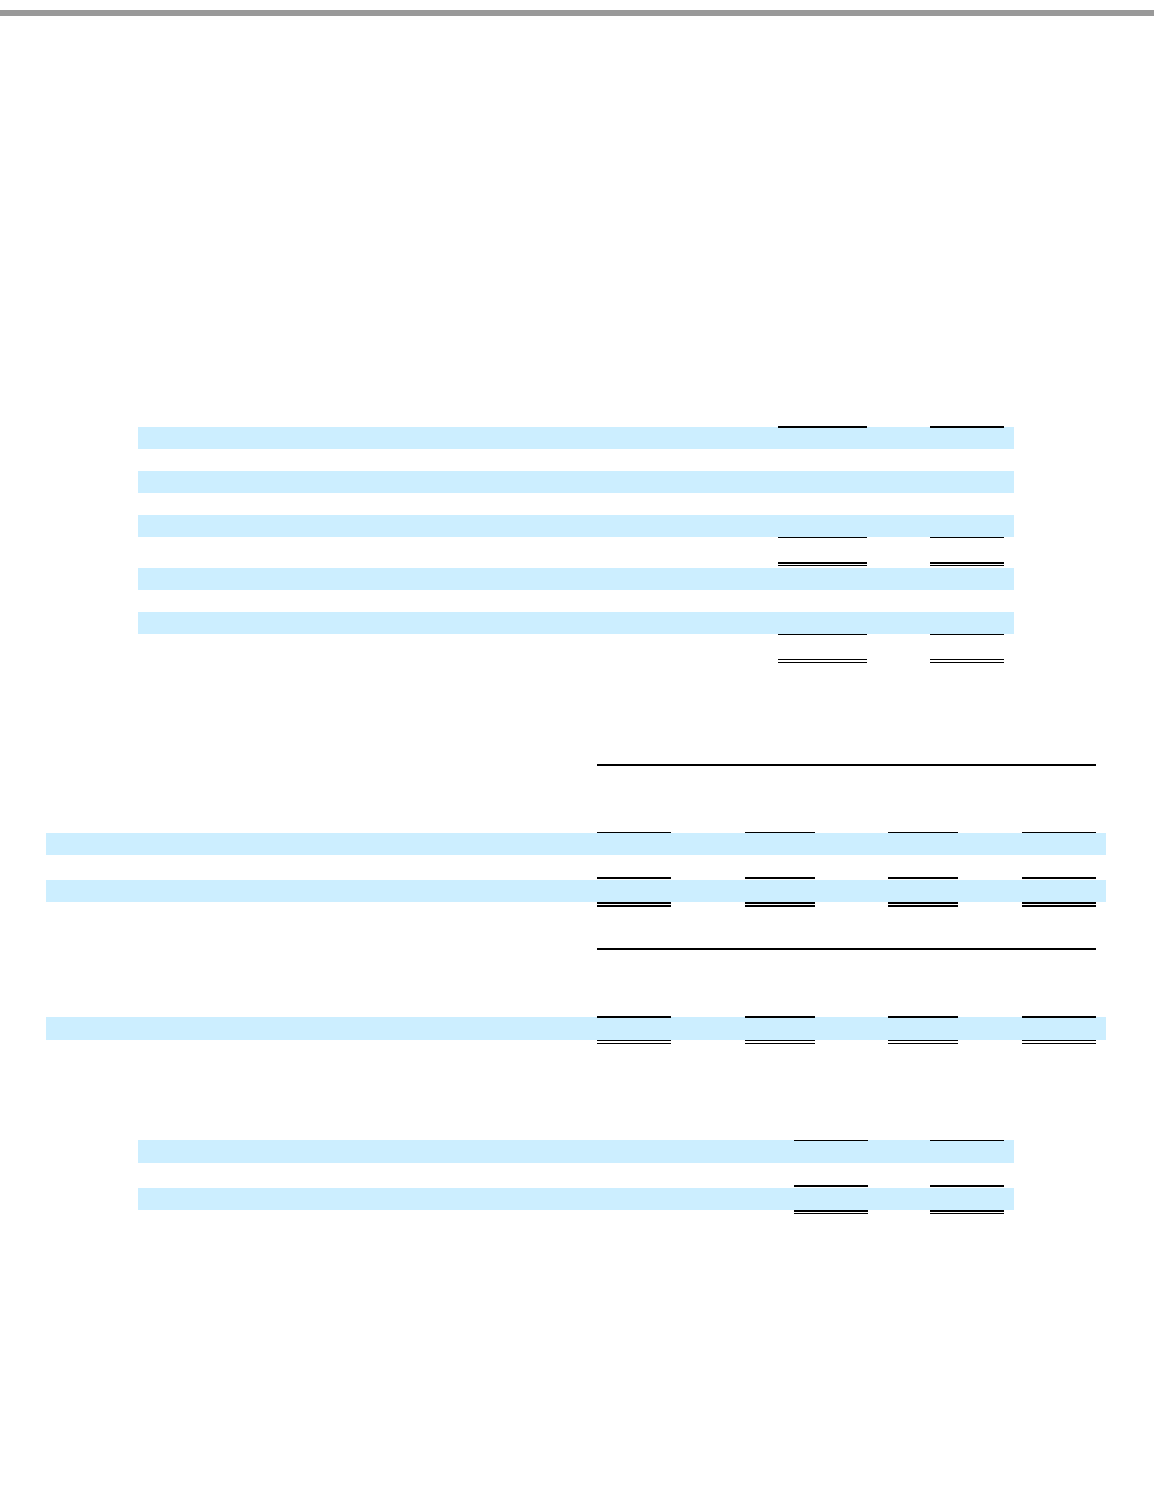
Table of Contents
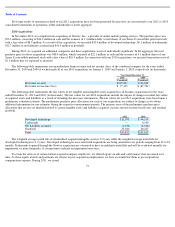
Facebook is the primary distribution, marketing, promotion and payment platform for our social games. A substantial majority of our 2011,
2010 and 2009 revenue was generated from players who accessed our games through Facebook. As of December 31, 2011 and December 31,
2010, 71% and 69% of our accounts receivable, respectively, were amounts owed to us by Facebook.
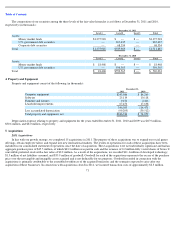
Advertising Expense
Costs for advertising are expensed as incurred. Advertising costs, which are included in sales and marketing expense, primarily consisting
of player acquisition costs, totaled $102.6 million, $83.4 million and $35.6 million for the years ended December 31, 2011, 2010 and 2009,
respectively.
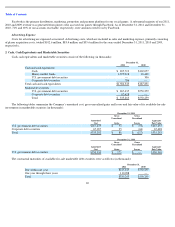
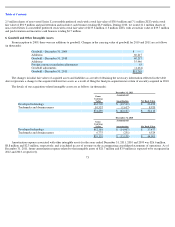
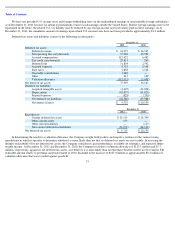
2. Cash, Cash Equivalents and Marketable Securities
Cash, cash equivalents and marketable securities consist of the following (in thousands):
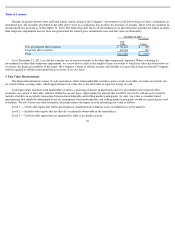
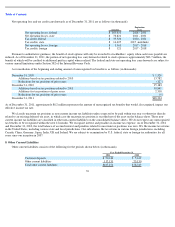
The following tables summarize the Company’s amortized cost, gross unrealized gains and losses and fair value of its available-for-sale
investments in marketable securities (in thousands):
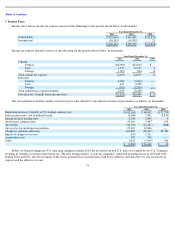
The contractual maturities of available-for-sale marketable debt securities were as follows (in thousands):
69
December 31,
2011
2010
Cash and cash equivalents:
Cash
$
205,719
$
169,057
Money market funds
1,375,918
18,468
U.S. government debt securities
—
306
Corporate debt securities
706
—
Total cash and cash equivalents
$
1,582,343
$
187,831
Marketable securities:
U.S. government debt securities
$
267,635
$
550,259
Corporate debt securities
67,628
—
Total
$
335,263
$
550,259
December 31, 2011
Amortized
Cost
Gross
Unrealized
Gains
Gross
Unrealized
Losses
Aggregate
Fair Value
U.S. government debt securities
$
267,635
$
53
$
(53
)
$
267,635
Corporate debt securities
67,657
35
(64
)
67,628
Total
$
335,292
$
88
$
(117
)
$
335,263
December 31, 2010
Amortized
Cost
Gross
Unrealized
Gains
Gross
Unrealized
Losses
Aggregate
Fair Value
U.S. government debt securities
$
550,390
$
175
$
—
$
550,565
December 31,
2011
2010
Due within one year
$
225,165
$
550,259
One year through three years
110,098
—
Total
$
335,263
$
550,259