Zynga 2011 Annual Report Download - page 66
Download and view the complete annual report
Please find page 66 of the 2011 Zynga annual report below. You can navigate through the pages in the report by either clicking on the pages listed below, or by using the keyword search tool below to find specific information within the annual report.-
 1
1 -
2
-
3
-
4
-
5
-
6
-
7
-
8
-
9
-
10
-
11
-
12
-
13
-
14
-
15
-
16
-
17
-
18
-
19
-
20
-
21
-
22
-
23
-
24
-
25
-
26
-
27
-
28
-
29
-
30
-
31
-
32
-
33
-
34
-
35
-
36
-
37
-
38
-
39
-
40
-
41
-
42
-
43
-
44
-
45
-
46
-
47
-
48
-
49
-
50
-
51
-
52
-
53
-
54
-
55
-
 56
56 -
 57
57 -
 58
58 -
 59
59 -
 60
60 -
 61
61 -
 62
62 -
 63
63 -
 64
64 -
 65
65 -
 66
66 -
 67
67 -
 68
68 -
 69
69 -
 70
70 -
 71
71 -
 72
72 -
 73
73 -
 74
74 -
 75
75 -
 76
76 -
77
-
78
-
79
-
80
-
81
-
82
-
83
-
84
-
85
-
86
-
87
-
88
-
89
-
90
-
91
-
92
-
93
-
94
-
95
-
96
-
97
-
98
-
99
-
100
-
101
-
102
-
103
-
104
 |
 |

Table of Contents
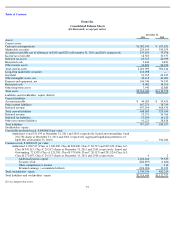
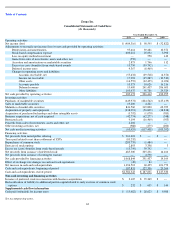
Zynga Inc.
Consolidated Statements of Cash Flows
(In thousands)
See accompanying notes.
62
Year Ended December 31,
2011
2010
2009
Operating activities
Net income (loss)
$
(404,316
)
$
90,595
$
(52,822
)
Adjustments to reconcile net income (loss) to net cash provided by operating activities:
Depreciation and amortization
95,414
39,481
10,372
Stock
-
based compensation expense
600,212
25,694
3,990
Loss on equity method investment
—
558
142
Gains from sales of investments, assets and other, net
(550
)
—
—
Accretion and amortization on marketable securities
2,873
1,746
112
Excess tax costs (benefits) from stock
-
based awards
13,750
(39,742
)
—
Deferred income taxes
4,367
(8,469
)
—
Changes in operating assets and liabilities:
Accounts receivable, net
(55,432
)
(69,518
)
(4,376
)
Income tax receivable
17,994
(25,287
)
(10,510
)
Other assets
(14,559
)
(32,495
)
(3,056
)
Accounts payable
10,373
10,626
16,216
Deferred revenue
15,409
241,437
206,603
Other liabilities
103,637
91,786
24,324
Net cash provided by operating activities
389,172
326,412
190,995
Investing activities
Purchases of marketable securities
(649,972
)
(804,542
)
(125,139
)
Sales of marketable securities
19,206
4,222
—
Maturities of marketable securities
841,560
319,820
62,399
Acquisition of property and equipment
(238,091
)
(56,839
)
(38,818
)
Acquisition of purchased technology and other intangible assets
(3,792
)
(1,078
)
(583
)
Business acquisitions, net of cash acquired
(42,774
)
(62,277
)
(548
)
Restricted cash
9,194
(16,469
)
(503
)
Proceeds from sales of investments, assets and other, net
2,202
—
—
Other investing activities, net
(988
)
(275
)
(200
)
Net cash used in investing activities
(63,455
)
(617,438
)
(103,392
)
Financing activities
Net proceeds from initial public offering
$
961,403
$
—
$
—
Taxes paid related to net share settlement of ZSUs
(83,232
)
—
—
Repurchases of common stock
(283,770
)
(1,484
)
—
Exercise of stock options
2,893
3,358
3
Excess tax (costs) benefits from stock
-
based awards
(13,750
)
39,742
—
Net proceeds from issuance of preferred stock
485,300
305,231
14,166
Net proceeds from issuance of contingent warrant
—
4,590
—
Net cash provided by financing activities
1,068,844
351,437
14,169
Effect of exchange rate changes on cash and cash equivalents
(49
)
84
—
Net increase in cash and cash equivalents
1,394,512
60,495
101,772
Cash and cash equivalents, beginning of period
187,831
127,336
25,564
Cash and cash equivalents, end of period
$
1,582,343
$
187,831
$
127,336
Non
-
cash investing and financing activities
Issuance of preferred stock in connection with business acquisitions
$
2,105
$
35,269
$
—
Reclassification of liability to additional paid-in capital related to early exercise of common stock
options
$
232
$
605
$
144
Supplemental cash flow information
Cash paid (refunded) for income taxes
$
(15,682
)
$
28,623
$
9,988