Zynga 2011 Annual Report Download - page 65
Download and view the complete annual report
Please find page 65 of the 2011 Zynga annual report below. You can navigate through the pages in the report by either clicking on the pages listed below, or by using the keyword search tool below to find specific information within the annual report.-
 1
1 -
2
-
3
-
4
-
5
-
6
-
7
-
8
-
9
-
10
-
11
-
12
-
13
-
14
-
15
-
16
-
17
-
18
-
19
-
20
-
21
-
22
-
23
-
24
-
25
-
26
-
27
-
28
-
29
-
30
-
31
-
32
-
33
-
34
-
35
-
36
-
37
-
38
-
39
-
40
-
41
-
42
-
43
-
44
-
45
-
46
-
47
-
48
-
49
-
50
-
51
-
52
-
53
-
54
-
 55
55 -
 56
56 -
 57
57 -
 58
58 -
 59
59 -
 60
60 -
 61
61 -
 62
62 -
 63
63 -
 64
64 -
 65
65 -
 66
66 -
 67
67 -
 68
68 -
 69
69 -
 70
70 -
 71
71 -
 72
72 -
 73
73 -
 74
74 -
 75
75 -
76
-
77
-
78
-
79
-
80
-
81
-
82
-
83
-
84
-
85
-
86
-
87
-
88
-
89
-
90
-
91
-
92
-
93
-
94
-
95
-
96
-
97
-
98
-
99
-
100
-
101
-
102
-
103
-
104
 |
 |

Table of Contents
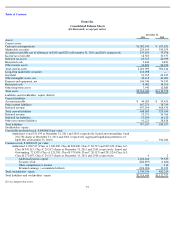
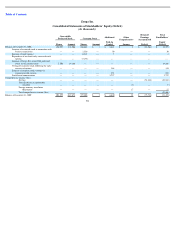
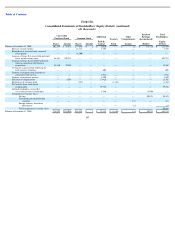
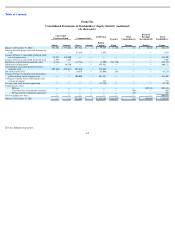
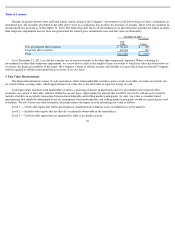
Zynga Inc.
Consolidated Statements of Stockholders’ Equity (Deficit) (continued)
(In thousands)
See accompanying notes.
61
Convertible
Preferred Stock
Common Stock
Additional
Paid-in
Capital
Treasury
Stock
Other
Comprehensive
Income
Retained
Earnings
(Accumulated)
(Deficit)
Total
Stockholders’
Equity
Shares
Amount
Shares
Amount
Balances at December 31, 2010
276,702
$
394,026
291,524
$
2
$
79,335
$
(1,484
)
$
114
$
10,222
$
482,215
Exercise of stock options and stock warrants for
cash
—
—
27,889
—
2,893
—
—
—
2,893
Issuance of Series C convertible preferred stock,
net of issuance costs
34,927
485,300
—
—
—
—
—
—
485,300
Issuance of Series Z convertible preferred stock
1,995
2,105
—
—
—
—
—
—
2,105
Repurchase of preferred and common stock
(8,764
)
—
(
18,716
)
—
(
2,500
)
(281,270
)
—
—
(
283,770
)
Stock
-
based compensation
—
44,230
—
—
555,982
—
—
—
600,212
Conversion of convertible preferred stock to
common stock
(304,860
)
(925,661
)
304,860
1
925,660
—
—
—
—
Net settlement of ZSUs
—
—
16,035
—
(
83,090
)
(143
)
—
—
(
83,233
)
Issuance of Class A common stock from initial
public offering, net of issuance costs
—
—
100,000
1
961,401
—
—
—
961,402
Vesting of common shares following the early
exercise of options
—
—
—
—
233
—
—
—
233
Tax cost from stock
-
based compensation
—
—
—
—
(
13,750
)
—
—
—
(
13,750
)
Comprehensive (loss):
Net loss
—
—
—
—
—
—
—
(
404,316
)
(404,316
)
Unrealized loss on marketable securities
—
—
—
—
—
—
(
208
)
—
(
208
)
Foreign currency translation adjustment
—
—
—
—
—
—
456
—
456
Total comprehensive (loss)
—
—
—
—
—
—
—
—
(
404,068
)
Balances at December 31, 2011
—
—
721,592
$
4
$
2,426,164
$
(282,897
)
$
362
$
(394,094
)
$
1,749,539