Zynga 2011 Annual Report Download - page 48
Download and view the complete annual report
Please find page 48 of the 2011 Zynga annual report below. You can navigate through the pages in the report by either clicking on the pages listed below, or by using the keyword search tool below to find specific information within the annual report.-
 1
1 -
2
-
3
-
4
-
5
-
6
-
7
-
8
-
9
-
10
-
11
-
12
-
13
-
14
-
15
-
16
-
17
-
18
-
19
-
20
-
21
-
22
-
23
-
24
-
25
-
26
-
27
-
28
-
29
-
30
-
31
-
32
-
33
-
34
-
35
-
36
-
37
-
 38
38 -
 39
39 -
 40
40 -
 41
41 -
 42
42 -
 43
43 -
 44
44 -
 45
45 -
 46
46 -
 47
47 -
 48
48 -
 49
49 -
 50
50 -
 51
51 -
 52
52 -
 53
53 -
 54
54 -
 55
55 -
 56
56 -
 57
57 -
 58
58 -
59
-
60
-
61
-
62
-
63
-
64
-
65
-
66
-
67
-
68
-
69
-
70
-
71
-
72
-
73
-
74
-
75
-
76
-
77
-
78
-
79
-
80
-
81
-
82
-
83
-
84
-
85
-
86
-
87
-
88
-
89
-
90
-
91
-
92
-
93
-
94
-
95
-
96
-
97
-
98
-
99
-
100
-
101
-
102
-
103
-
104
 |
 |

Table of Contents
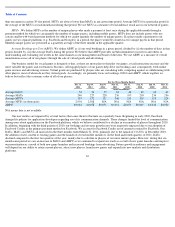
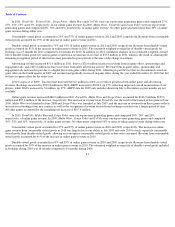
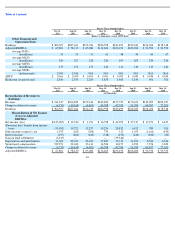
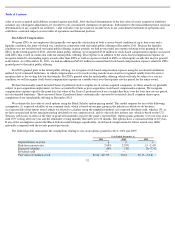
Other income (expense), net
2011 Compared to 2010. Other income (expense), net decreased $2.6 million in 2011. The decrease was primarily attributable to increased
interest expense under the terms of a revolving credit agreement signed in July 2011.
2010 Compared to 2009.
Other income (expense), net increased $0.6 million in 2010 primarily due to an increase in net transaction gain on
foreign exchange rate changes.
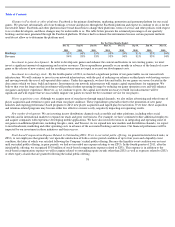
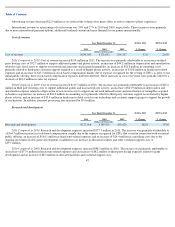
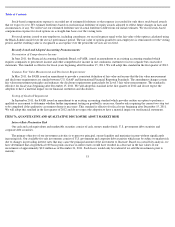
(Provision for) / benefit from income taxes
2011 Compared to 2010. The provision for income taxes decreased by $38.3 million in 2011. This decrease was attributable to the
decrease in pre-tax income from $127 million in the year ended December 31, 2010 to a pre-tax loss of $406.1 million in 2011. The decrease in
pre-tax income was primarily driven by stock-
based compensation expense associated with ZSUs that vested in connection with our initial public
offering. In addition, the income tax benefit associated with the loss generated in 2011 was primarily offset by a valuation allowance.
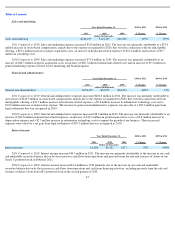
For the foreseeable future, our effective tax rate will be impacted by significant stock-based compensation expense and additional tax
expense associated with the implementation of our international tax structure. We expect stock-based compensation expense to generate
significant tax benefits which may be deducted against future income. As these deductions are recognized and the implementation of our
international tax structure is completed, we anticipate that our effective tax rate will be lower than the U.S. statutory rate.
Before we began forming non-U.S. operating companies during 2010, the revenue from non-U.S. users was earned by our U.S. company,
resulting in virtually no foreign profit before tax. The new foreign entities, as start-up companies, generated operating losses in 2011 and 2010.
The tax impact of the losses generated in tax jurisdictions with lower statutory rates than the U.S. rate increased tax expense and the effective tax
rate.
2010 Compared to 2009. Provision for income taxes increased $36.5 million in 2010, primarily as a result of the increase in pre-
tax income
in 2010 from a pre-tax loss in 2009. In 2010, we recorded a provision for income taxes that was principally attributable to U.S. federal taxes,
California taxes and foreign taxes. The effective tax rate for 2010 was 28.7%. The increase in our annual effective tax rate for 2010 was driven
by the implementation cost of our international tax structure, state income taxes and non-deductible stock-based compensation expense. These
increases were offset by the benefit of releasing the federal valuation allowance in 2010 due to our achievement of profitability, and by the
utilization of both federal and California research and development credits.
44
Year Ended December 31,
2010 to 2011
% Change
2009 to 2010
% Change
2011
2010
2009
(dollars in thousands)
Other income (expense), net
$
(2,206
)
$
365
$
(209
)
NM
NM
Year Ended December 31,
2010 to 2011
% Change
2009 to 2010
% Change
2011
2010
2009
(dollars in thousands)
(Provision for) / benefit from income taxes
$
1,826
$
(36,464
)
$
(12
)
NM
NM