Zynga 2011 Annual Report Download - page 62
Download and view the complete annual report
Please find page 62 of the 2011 Zynga annual report below. You can navigate through the pages in the report by either clicking on the pages listed below, or by using the keyword search tool below to find specific information within the annual report.-
 1
1 -
2
-
3
-
4
-
5
-
6
-
7
-
8
-
9
-
10
-
11
-
12
-
13
-
14
-
15
-
16
-
17
-
18
-
19
-
20
-
21
-
22
-
23
-
24
-
25
-
26
-
27
-
28
-
29
-
30
-
31
-
32
-
33
-
34
-
35
-
36
-
37
-
38
-
39
-
40
-
41
-
42
-
43
-
44
-
45
-
46
-
47
-
48
-
49
-
50
-
51
-
 52
52 -
 53
53 -
 54
54 -
 55
55 -
 56
56 -
 57
57 -
 58
58 -
 59
59 -
 60
60 -
 61
61 -
 62
62 -
 63
63 -
 64
64 -
 65
65 -
 66
66 -
 67
67 -
 68
68 -
 69
69 -
 70
70 -
 71
71 -
 72
72 -
73
-
74
-
75
-
76
-
77
-
78
-
79
-
80
-
81
-
82
-
83
-
84
-
85
-
86
-
87
-
88
-
89
-
90
-
91
-
92
-
93
-
94
-
95
-
96
-
97
-
98
-
99
-
100
-
101
-
102
-
103
-
104
 |
 |

Table of Contents
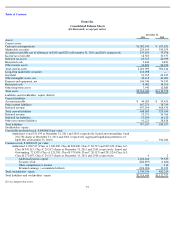
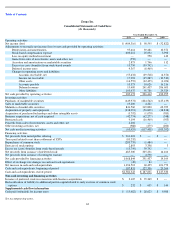
Zynga Inc.
Consolidated Statements of Operations
(In thousands, except per share data)
See accompanying notes.
58
Year Ended December 31,
2011
2010
2009
Revenue
$
1,140,100
$
597,459
$
121,467
Costs and expenses:
Cost of revenue
330,043
176,052
56,707
Research and development
727,018
149,519
51,029
Sales and marketing
234,199
114,165
42,266
General and administrative
254,456
32,251
24,243
Total costs and expenses
1,545,716
471,987
174,245
Income (loss) from operations
(405,616
)
125,472
(52,778
)
Interest income
1,680
1,222
177
Other income (expense), net
(2,206
)
365
(209
)
Income (loss) before income taxes
(406,142
)
127,059
(52,810
)
(Provision for) / benefit from income taxes
1,826
(36,464
)
(12
)
Net income (loss)
$
(404,316
)
$
90,595
$
(52,822
)
Deemed dividend to a Series B
-
2 convertible preferred stockholder
—
4,590
—
Net income attributable to participating securities
—
58,110
—
Net income (loss) attributable to common stockholders
$
(404,316
)
$
27,895
$
(52,822
)
Net income (loss) per share attributable to common stockholders
Basic
$
(1.40
)
$
0.12
$
(0.31
)
Diluted
$
(1.40
)
$
0.11
$
(0.31
)
Weighted average common shares used to compute net income (loss) per share attributable to
common stockholders:
Basic
288,599
223,881
171,751
Diluted
288,599
329,256
171,751