Zynga 2011 Annual Report Download - page 50
Download and view the complete annual report
Please find page 50 of the 2011 Zynga annual report below. You can navigate through the pages in the report by either clicking on the pages listed below, or by using the keyword search tool below to find specific information within the annual report.-
 1
1 -
2
-
3
-
4
-
5
-
6
-
7
-
8
-
9
-
10
-
11
-
12
-
13
-
14
-
15
-
16
-
17
-
18
-
19
-
20
-
21
-
22
-
23
-
24
-
25
-
26
-
27
-
28
-
29
-
30
-
31
-
32
-
33
-
34
-
35
-
36
-
37
-
38
-
39
-
 40
40 -
 41
41 -
 42
42 -
 43
43 -
 44
44 -
 45
45 -
 46
46 -
 47
47 -
 48
48 -
 49
49 -
 50
50 -
 51
51 -
 52
52 -
 53
53 -
 54
54 -
 55
55 -
 56
56 -
 57
57 -
 58
58 -
 59
59 -
 60
60 -
61
-
62
-
63
-
64
-
65
-
66
-
67
-
68
-
69
-
70
-
71
-
72
-
73
-
74
-
75
-
76
-
77
-
78
-
79
-
80
-
81
-
82
-
83
-
84
-
85
-
86
-
87
-
88
-
89
-
90
-
91
-
92
-
93
-
94
-
95
-
96
-
97
-
98
-
99
-
100
-
101
-
102
-
103
-
104
 |
 |

Table of Contents
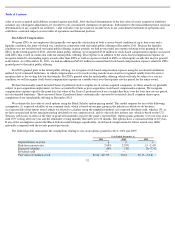
46
For the Three Months Ended
Dec 31,
2011
Sep 30,
2011
Jun 30,
2011
Mar 31,
2011
Dec 31,
2010
Sep 30,
2010
Jun 30,
2010
Mar 31,
2010
(dollars in thousands, except ABPU data)
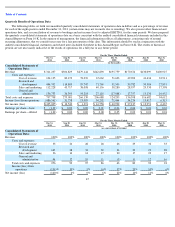
Other Financial and
Operations Data:
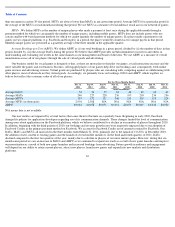
Bookings
$
306,507
$
287,661
$
274,743
$
286,598
$
243,499
$
222,383
$
194,696
$
178,318
Adjusted EBITDA
$
67,801
$
58,130
$
65,080
$
112,263
$
103,192
$
102,200
$
93,794
$
93,552
Average DAUs
(in millions)
54
54
59
62
48
49
60
67
Average MAUs
(in millions)
240
227
228
236
195
203
234
236
Average MUUs
(in millions)
153
152
151
146
111
110
119
124
Average MUPs
(in thousands)
2,901
2,568
N/A
N/A
N/A
N/A
N/A
N/A
ABPU
$
0.061
$
0.058
$
0.051
$
0.051
$
0.055
$
0.049
$
0.036
$
0.030
Headcount (at period end)
2,846
2,789
2,289
1,858
1,483
1,246
961
761
For the Three Months Ended
Dec 31,
2011
Sep 30,
2011
Jun 30,
2011
Mar 31,
2011
Dec 31,
2010
Sep 30,
2010
Jun 30,
2010
Mar 31,
2010
(in thousands)
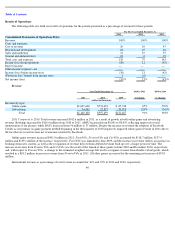
Reconciliation of Revenue to
Bookings:
Revenue
$
311,237
$
306,829
$
279,144
$
242,890
$
195,759
$
170,674
$
130,099
$
100,927
Change in deferred revenue
(4,730
)
(19,168
)
(4,401
)
43,708
47,740
51,709
64,597
77,391
Bookings
$
306,507
$
287,661
$
274,743
$
286,598
$
243,499
$
222,383
$
194,696
$
178,318
Reconciliation of Net Income
(Loss) to Adjusted
EBITDA:
Net income (loss)
$
(435,005
)
$
12,540
$
1,391
$
16,758
$
42,992
$
27,217
$
13,951
$
6,435
(Provision for) / benefit from income
taxes
(53,032
)
19,723
12,257
19,226
28,832
6,452
789
391
Other income (expense), net
1,933
(263
)
(200
)
736
113
1,053
(1,101
)
(430
)
Interest income
(457
)
(262
)
(443
)
(518
)
(473
)
(446
)
(222
)
(81
)
Gain on legal settlements
(2,145
)
—
—
—
(
39,346
)
—
—
—
Depreciation and amortization
31,266
22,936
23,365
17,847
13,139
11,292
8,504
6,546
Stock
-
based compensation
529,971
22,624
33,111
14,506
10,195
4,923
7,276
3,300
Change in deferred revenue
(4,730
)
(19,168
)
(4,401
)
43,708
47,740
51,709
64,597
77,391
Adjusted EBITDA
$
67,801
$
58,130
$
65,080
$
112,263
$
103,192
$
102,200
$
93,794
$
93,552