Zynga 2011 Annual Report Download - page 47
Download and view the complete annual report
Please find page 47 of the 2011 Zynga annual report below. You can navigate through the pages in the report by either clicking on the pages listed below, or by using the keyword search tool below to find specific information within the annual report.-
 1
1 -
2
-
3
-
4
-
5
-
6
-
7
-
8
-
9
-
10
-
11
-
12
-
13
-
14
-
15
-
16
-
17
-
18
-
19
-
20
-
21
-
22
-
23
-
24
-
25
-
26
-
27
-
28
-
29
-
30
-
31
-
32
-
33
-
34
-
35
-
36
-
 37
37 -
 38
38 -
 39
39 -
 40
40 -
 41
41 -
 42
42 -
 43
43 -
 44
44 -
 45
45 -
 46
46 -
 47
47 -
 48
48 -
 49
49 -
 50
50 -
 51
51 -
 52
52 -
 53
53 -
 54
54 -
 55
55 -
 56
56 -
 57
57 -
58
-
59
-
60
-
61
-
62
-
63
-
64
-
65
-
66
-
67
-
68
-
69
-
70
-
71
-
72
-
73
-
74
-
75
-
76
-
77
-
78
-
79
-
80
-
81
-
82
-
83
-
84
-
85
-
86
-
87
-
88
-
89
-
90
-
91
-
92
-
93
-
94
-
95
-
96
-
97
-
98
-
99
-
100
-
101
-
102
-
103
-
104
 |
 |

Table of Contents
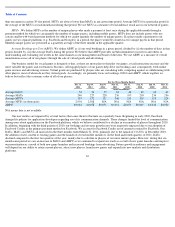
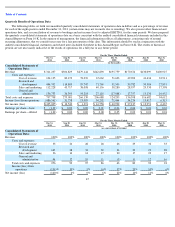
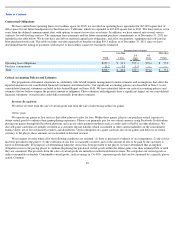
Sales and marketing
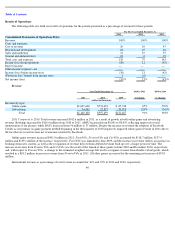
2011 Compared to 2010. Sales and marketing expenses increased $120 million in 2011. The increase was primarily attributable to a $73.4
million increase in stock-based compensation, mainly due to the expense recognized for ZSUs that vested in connection with our initial public
offering, a $23.2 million increase in player acquisition costs, an increase in headcount-related expenses of $13.4 million and increase of $5.7
million in consulting costs.
2010 Compared to 2009. Sales and marketing expenses increased $71.9 million in 2010. The increase was primarily attributable to an
increase of $44.5 million in player acquisition costs, an increase of $18.7 million in headcount-related costs and an increase of $5.5 million in
general marketing expenses related to new marketing and brand programs.
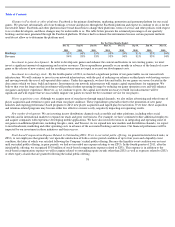
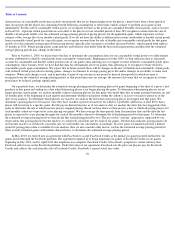
General and administrative
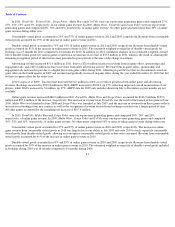
2011 Compared to 2010. General and administrative expenses increased $222.2 million in 2011. The increase was primarily attributable to
an increase of $120.9 million in stock-based compensation, mainly due to the expense recognized for ZSUs that vested in connection with our
initial public offering, a $41.7 million increase in headcount-related expenses, a $9.8 million increase in information technology costs and a
$10.0 million increase in depreciation expense. The increase in general and administrative expenses was also due to a $39.3 million gain from
legal settlements that was recognized in 2010.
2010 Compared to 2009.
General and administrative expenses increased $8.0 million in 2010. The increase was primarily attributable to an
increase of $22.8 million in headcount-related expenses, an increase of $14.0 million in professional service costs, a $4.8 million increase in
depreciation expense and a $2.5 million increase in information technology costs to support the growth of our business. These increased
expenses were offset by a net gain from legal settlements of $39.3 million that was recognized in 2010.
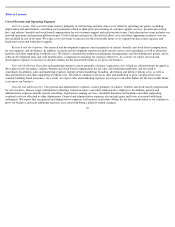
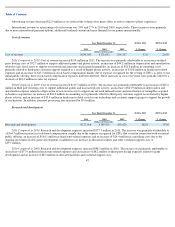
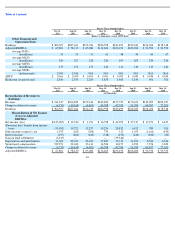
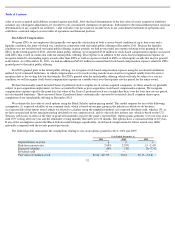
Interest income
2011 Compared to 2010.
Interest income increased $0.5 million in 2011. The increase was primarily attributable to the increase in our cash
and marketable securities balance driven by the increase in cash flows from operations and proceeds from the sale and issuance of shares of our
Series C preferred stock in February 2011.
2010 Compared to 2009 . Interest income increased $1.0 million in 2010 primarily due to the increase in our cash and marketable
securities balance driven by the increase in cash flows from operations and cash from financing activities, including proceeds from the sale and
issuance of shares of our Series B-2 preferred stock in the second quarter of 2010.
43
Year Ended December 31,
2010 to 2011
% Change
2009 to 2010
% Change
2011
2010
2009
(dollars in thousands)
Sales and marketing
$
234,199
$
114,165
$
42,266
105
%
170
%
Year Ended December 31,
2010 to 2011
% Change
2009 to 2010
% Change
2011
2010
2009
(dollars in thousands)
General and administrative
$
254,456
$
32,251
$
24,243
689
%
33
%
Year Ended December 31,
2010 to 2011
% Change
2009 to 2010
% Change
2011
2010
2009
(dollars in thousands)
Interest income
$
1,680
$
1,222
$
177
37
%
590
%