Zynga 2011 Annual Report Download - page 38
Download and view the complete annual report
Please find page 38 of the 2011 Zynga annual report below. You can navigate through the pages in the report by either clicking on the pages listed below, or by using the keyword search tool below to find specific information within the annual report.-
 1
1 -
2
-
3
-
4
-
5
-
6
-
7
-
8
-
9
-
10
-
11
-
12
-
13
-
14
-
15
-
16
-
17
-
18
-
19
-
20
-
21
-
22
-
23
-
24
-
25
-
26
-
27
-
 28
28 -
 29
29 -
 30
30 -
 31
31 -
 32
32 -
 33
33 -
 34
34 -
 35
35 -
 36
36 -
 37
37 -
 38
38 -
 39
39 -
 40
40 -
 41
41 -
 42
42 -
 43
43 -
 44
44 -
 45
45 -
 46
46 -
 47
47 -
 48
48 -
49
-
50
-
51
-
52
-
53
-
54
-
55
-
56
-
57
-
58
-
59
-
60
-
61
-
62
-
63
-
64
-
65
-
66
-
67
-
68
-
69
-
70
-
71
-
72
-
73
-
74
-
75
-
76
-
77
-
78
-
79
-
80
-
81
-
82
-
83
-
84
-
85
-
86
-
87
-
88
-
89
-
90
-
91
-
92
-
93
-
94
-
95
-
96
-
97
-
98
-
99
-
100
-
101
-
102
-
103
-
104
 |
 |

Table of Contents
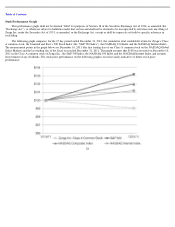
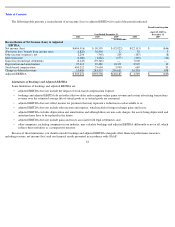
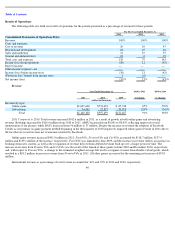
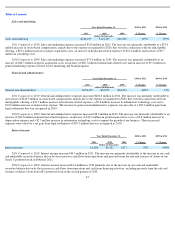
In 2011, our revenue and bookings were $1.14 billion and $1.16 billion, respectively, which represented increases from 2010 of $542.6
million and $316.6 million, respectively. Consistent with our free-to-play business model, compared to all players who play our games in any
period, only a small portion are payers. Because the opportunity for social interactions increases as the number of players increases, we believe
that maintaining and growing our overall number of players, including the number of players who may not purchase virtual goods, is important
to the success of our business. As a result, we believe that the number of players who choose to purchase virtual goods will continue to constitute
a small portion of our overall players as our business grows.
The games that constitute our top three games vary over time but historically the top three revenue-generating games in any period
contributed the majority of our revenue. Our top three games accounted for 57%, 78% and 83% of our online game revenue in 2011, 2010 and
2009, respectively. The reduction in percentage of online game revenue related to our top three games occurred throughout these periods as new
games were launched and we recognized revenue from these games.
We made significant investments in 2011 to drive long-
term growth. We continue to invest in game development, creating both new games
and new features and content in existing games designed to engage our players. We are also investing in other key areas of our business,
including international market development, mobile games and our technology infrastructure. In 2012, we expect to make capital expenditures of
up to $160 million as we invest in network infrastructure to support our expected growth and to continue to improve the player experience.
How We Generate Revenue
We operate our games as live services that allow players to play for free. We generate revenue primarily from the in-game sale of virtual
goods and advertising.
Online Game. We provide our players with the opportunity to purchase virtual goods that enhance their game-playing experience. We
believe players choose to pay for virtual goods for the same reasons they are willing to pay for other forms of entertainment. They enjoy the
additional playing time or added convenience, the ability to personalize their own game boards, the satisfaction of leveling up and the
opportunity for sharing creative expressions. We believe players are more likely to purchase virtual goods when they are connected to and
playing with their friends, whether those friends play for free or also purchase virtual goods.
In May 2010, we entered into an addendum to Facebook’s standard terms and conditions requiring us to transition our payment method to
Facebook Credits, Facebook’s proprietary payment method, as the primary means of payment within our games played through Facebook. We
began migrating to Facebook Credits in July 2010, and in April 2011, we completed this migration. Under this addendum, Facebook remits to us
an amount equal to 70% of the face value of Facebook Credits purchased by our players for use in our games. We recognize revenue net of
amounts retained by Facebook. Prior to this addendum, we used third-party payment processors and paid these processors service fees ranging
from 2% to 10% of the purchase price of our virtual goods which were recorded in cost of revenue. Players can purchase Facebook Credits from
Facebook, directly through our games or through game cards purchased from retailers and distributors.
On platforms other than Facebook, players purchase our virtual goods through various widely accepted payment methods offered in the
games, including credit cards, PayPal, Apple iTunes accounts and direct wires. Players can purchase game cards from retailers and distributors
for use on these platforms.
Advertising. Advertising revenue primarily includes branded virtual goods and sponsorships, engagement ads and offers, mobile ads and
display ads. We generally report our advertising revenue net of amounts due to advertising agencies and brokers.
Revenue growth will depend largely on our ability to attract and retain players and more effectively monetize our player base through the
sale of virtual goods and advertising. We intend to do this through the launch of new games, enhancements to current games and expansion into
new markets and distribution platforms.
34