Zynga 2011 Annual Report Download - page 61
Download and view the complete annual report
Please find page 61 of the 2011 Zynga annual report below. You can navigate through the pages in the report by either clicking on the pages listed below, or by using the keyword search tool below to find specific information within the annual report.-
 1
1 -
2
-
3
-
4
-
5
-
6
-
7
-
8
-
9
-
10
-
11
-
12
-
13
-
14
-
15
-
16
-
17
-
18
-
19
-
20
-
21
-
22
-
23
-
24
-
25
-
26
-
27
-
28
-
29
-
30
-
31
-
32
-
33
-
34
-
35
-
36
-
37
-
38
-
39
-
40
-
41
-
42
-
43
-
44
-
45
-
46
-
47
-
48
-
49
-
50
-
 51
51 -
 52
52 -
 53
53 -
 54
54 -
 55
55 -
 56
56 -
 57
57 -
 58
58 -
 59
59 -
 60
60 -
 61
61 -
 62
62 -
 63
63 -
 64
64 -
 65
65 -
 66
66 -
 67
67 -
 68
68 -
 69
69 -
 70
70 -
 71
71 -
72
-
73
-
74
-
75
-
76
-
77
-
78
-
79
-
80
-
81
-
82
-
83
-
84
-
85
-
86
-
87
-
88
-
89
-
90
-
91
-
92
-
93
-
94
-
95
-
96
-
97
-
98
-
99
-
100
-
101
-
102
-
103
-
104
 |
 |

Table of Contents
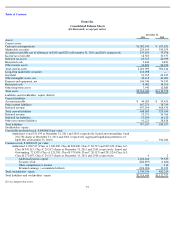
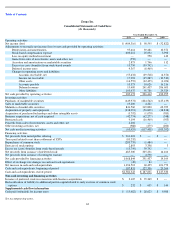
Zynga Inc.
Consolidated Balance Sheets
(In thousands, except par value)
See accompanying notes.
57
December 31,
2011
2010
Assets
Current assets:
Cash and cash equivalents
$
1,582,343
$
187,831
Marketable securities
225,165
550,259
Accounts receivable, net of allowance of $163 and $325 at December 31, 2011 and 2010, respectively
135,633
79,974
Income tax receivable
18,583
36,577
Deferred tax assets
23,515
24,399
Restricted cash
3,846
2,821
Other current assets
34,824
24,353
Total current assets
2,023,909
906,214
Long
-
term marketable securities
110,098
—
Goodwill
91,765
60,217
Other intangible assets, net
32,112
44,001
Property and equipment, net
246,740
74,959
Restricted cash
4,082
14,301
Other long
-
term assets
7,940
12,880
Total assets
$
2,516,646
$
1,112,572
Liabilities and stockholders
’
equity (deficit)
Current liabilities:
Accounts payable
$
44,020
$
33,431
Other current liabilities
167,271
78,749
Deferred revenue
457,394
408,470
Total current liabilities
668,685
520,650
Deferred revenue
23,251
56,766
Deferred tax liabilities
13,950
14,123
Other non
-
current liabilities
61,221
38,818
Total liabilities
767,107
630,357
Stockholders
’
equity:
Convertible preferred stock, $.00000625 par value:
Authorized, 0 and 351,199 at December 31, 2011 and 2010, respectively. Issued and outstanding, 0 and
276,702 shares at December 31, 2011 and 2010, respectively (aggregate liquidation preference of
$849,380 at December 31, 2010)
—
394,026
Common stock, $.00000625 par value:
Authorized, 2,020,517 (Class A 1,100,000, Class B 900,000, Class C 20,517) and 965,632 (Class A 0,
Class B 945,115, Class C 20,517) shares at December 31, 2011 and 2010, respectively. Issued and
Outstanding, 721,592 (Class A 121,381, Class B 579,694, Class C 20,517) and 291,524 (Class A 0,
Class B 271,007, Class C 20,517) shares at December 31, 2011 and 2010, respectively;
4
2
Additional paid
-
in capital
2,426,164
79,335
Treasury stock
(282,897
)
(1,484
)
Other comprehensive income
362
114
Retained earnings ( accumulated deficit)
(394,094
)
10,222
Total stockholders
’
equity
1,749,539
482,215
Total liabilities and stockholders
’
equity
$
2,516,646
$
1,112,572