Zynga 2011 Annual Report Download - page 42
Download and view the complete annual report
Please find page 42 of the 2011 Zynga annual report below. You can navigate through the pages in the report by either clicking on the pages listed below, or by using the keyword search tool below to find specific information within the annual report.-
 1
1 -
2
-
3
-
4
-
5
-
6
-
7
-
8
-
9
-
10
-
11
-
12
-
13
-
14
-
15
-
16
-
17
-
18
-
19
-
20
-
21
-
22
-
23
-
24
-
25
-
26
-
27
-
28
-
29
-
30
-
31
-
 32
32 -
 33
33 -
 34
34 -
 35
35 -
 36
36 -
 37
37 -
 38
38 -
 39
39 -
 40
40 -
 41
41 -
 42
42 -
 43
43 -
 44
44 -
 45
45 -
 46
46 -
 47
47 -
 48
48 -
 49
49 -
 50
50 -
 51
51 -
 52
52 -
53
-
54
-
55
-
56
-
57
-
58
-
59
-
60
-
61
-
62
-
63
-
64
-
65
-
66
-
67
-
68
-
69
-
70
-
71
-
72
-
73
-
74
-
75
-
76
-
77
-
78
-
79
-
80
-
81
-
82
-
83
-
84
-
85
-
86
-
87
-
88
-
89
-
90
-
91
-
92
-
93
-
94
-
95
-
96
-
97
-
98
-
99
-
100
-
101
-
102
-
103
-
104
 |
 |

Table of Contents
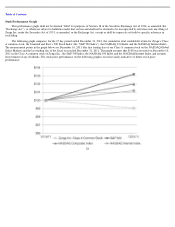
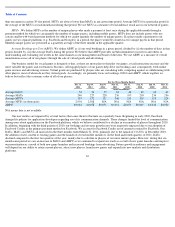
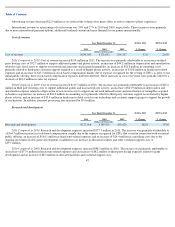
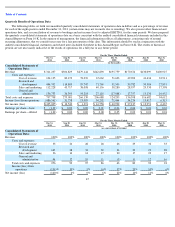
Changes in Facebook or other platforms. Facebook is the primary distribution, marketing, promotion and payment platform for our social
games. We generate substantially all of our bookings, revenue and players through the Facebook platform and expect to continue to do so for the
foreseeable future. Facebook and other platforms have broad discretion to change their platforms, terms of service and other policies with respect
to us or other developers, and those changes may be unfavorable to us. The table below presents the estimated percentages of our quarterly
bookings and revenue generated through the Facebook platform. We have had to estimate this information because certain payment methods
used do not allow us to determine the platform used.
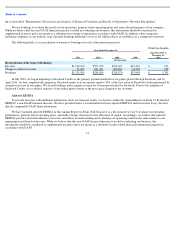
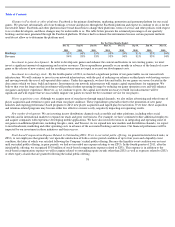
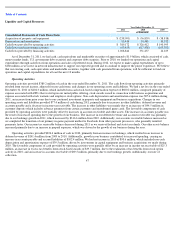
Investment in game development . In order to develop new games and enhance the content and features in our existing games, we must
invest a significant amount of engineering and creative resources. These expenditures generally occur months in advance of the launch of a new
game or the release of new content, and the resulting revenue may not equal or exceed our development costs.
Investment in technology stack . By the fourth quarter of 2011, we hosted a significant portion of our game traffic on our own network
infrastructure. We will continue to invest in our network infrastructure, with the goal of reducing our reliance on third-
party web hosting services
and moving towards the use of self-operated data centers. Under this approach, we host data and traffic for our games on servers located in the
data centers which we lease, build and operate. Investment in our network infrastructure will require capital expenditures for equipment. We
believe that over the long term this investment will produce further operating leverage by reducing our game operation costs and will enhance
our games and player experience. However, as we continue to grow, the capital investment necessary to build our infrastructure will be
significant and will require that we successfully migrate our games to ensure the best customer service for our players.
Player acquisition costs. Although we acquire most of our players through unpaid channels, we also utilize advertising and other forms of
player acquisition and retention to grow and retain our player audience. These expenditures generally relate to the promotion of new game
launches and ongoing performance-based programs to drive new player acquisition and lapsed player reactivation. Over time, these acquisition
and retention-related programs may become either less effective or more costly, negatively impacting our operating results.
New market development. We are investing in new distribution channels such as mobile and other platforms, including other social
networks and in international markets to expand our reach and grow our business. For example, we have continued to hire additional employees
and acquire companies with experience developing mobile applications. We have also invested resources in integrating and operating some of
our games on additional platforms, including Google+, mixi, and Tencent. As we expand into new markets and distribution channels, we expect
to incur headcount, marketing and other operating costs in advance of the associated bookings and revenue. Our financial performance will be
impacted by our investment in these initiatives and their success.
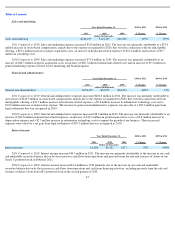
Stock-based Compensation Expense Related to Outstanding ZSUs. Prior to our initial public offering, we granted restricted stock units, or
ZSUs, to our employees that generally vest upon the satisfaction of both a service-period condition of up to four years and a liquidity event
condition, the latter of which was satisfied following the Company’s initial public offering. Because the liquidity event condition was not met
until our initial public offering, in prior periods, we had not recorded any expense relating to our ZSUs. In the fourth quarter of 2011, after the
initial public offering, we recognized $510 million of stock-based compensation expense related to ZSUs. This expense is in addition to the
stock-based compensation expense we will recognize related to outstanding equity awards other than ZSUs as well as expenses related to ZSUs
or other equity awards that are granted following the initial public offering.
38
For the Three Months Ended:
Dec 31,
2011
Sep 30,
2011
Jun 30,
2011
Mar 31,
2011
Dec 31,
2010
Sep 30,
2010
Jun 30,
2010
Mar 31,
2010
Bookings
93
%
94
%
93
%
93
%
93
%
91
%
93
%
94
%
Revenue
94
%
93
%
93
%
93
%
94
%
91
%
93
%
94
%