Xcel Energy 2007 Annual Report Download - page 84
Download and view the complete annual report
Please find page 84 of the 2007 Xcel Energy annual report below. You can navigate through the pages in the report by either clicking on the pages listed below, or by using the keyword search tool below to find specific information within the annual report.-
 1
1 -
2
-
3
-
4
-
5
-
6
-
7
-
8
-
9
-
10
-
11
-
12
-
13
-
14
-
15
-
16
-
17
-
18
-
19
-
20
-
21
-
22
-
23
-
24
-
25
-
26
-
27
-
28
-
29
-
30
-
31
-
32
-
33
-
34
-
35
-
36
-
37
-
38
-
39
-
40
-
41
-
42
-
43
-
44
-
45
-
46
-
47
-
48
-
49
-
50
-
51
-
52
-
53
-
54
-
55
-
56
-
57
-
58
-
59
-
60
-
61
-
62
-
63
-
64
-
65
-
66
-
67
-
68
-
69
-
70
-
71
-
72
-
73
-
 74
74 -
 75
75 -
 76
76 -
 77
77 -
 78
78 -
 79
79 -
 80
80 -
 81
81 -
 82
82 -
 83
83 -
 84
84 -
 85
85 -
 86
86 -
 87
87 -
 88
88 -
 89
89 -
 90
90 -
 91
91 -
 92
92 -
 93
93 -
 94
94 -
95
-
96
-
97
-
98
-
99
-
100
-
101
-
102
-
103
-
104
-
105
-
106
-
107
-
108
-
109
-
110
-
111
-
112
-
113
-
114
-
115
-
116
-
117
-
118
-
119
-
120
-
121
-
122
-
123
-
124
-
125
-
126
-
127
-
128
-
129
-
130
-
131
-
132
-
133
-
134
-
135
-
136
-
137
-
138
-
139
-
140
-
141
-
142
-
143
-
144
-
145
-
146
-
147
-
148
-
149
-
150
-
151
-
152
-
153
-
154
-
155
-
156
 |
 |

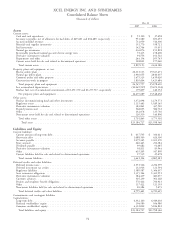
XCEL ENERGY INC. AND SUBSIDIARIES
Consolidated Balance Sheets
(thousands of dollars)
Dec. 31
2007 2006
Assets
Current assets:
Cash and cash equivalents ................................................. $ 51,120 $ 37,458
Accounts receivable, net of allowance for bad debts of $49,401 and $36,689, respectively .......... 951,580 833,293
Accrued unbilled revenues ................................................. 731,959 514,300
Materials and supplies inventories ............................................ 152,770 158,721
Fuel inventories ........................................................ 142,764 95,651
Natural gas inventories ................................................... 236,076 251,818
Recoverable purchased natural gas and electric energy costs ............................. 73,415 258,600
Derivative instruments valuation ............................................. 94,554 101,562
Prepayments and other ................................................... 244,134 205,743
Current assets held for sale and related to discontinued operations ........................ 128,821 177,040
Total current assets .................................................... 2,807,193 2,634,186
Property, plant and equipment, at cost:
Electric utility plant ..................................................... 20,313,313 19,367,671
Natural gas utility plant ................................................... 2,946,455 2,846,435
Common utility and other property ........................................... 1,475,325 1,439,020
Construction work in progress .............................................. 1,810,664 1,425,484
Total property, plant and equipment ......................................... 26,545,757 25,078,610
Less accumulated depreciation ............................................... (10,049,927) (9,670,104)
Nuclear fuel, net of accumulated amortization of $1,291,370 and $1,237,917, respectively ......... 179,859 140,152
Net property, plant and equipment .......................................... 16,675,689 15,548,658
Other assets:
Nuclear decommissioning fund and other investments ................................ 1,372,098 1,279,573
Regulatory assets ....................................................... 1,115,443 1,189,145
Derivative instruments valuation ............................................. 383,861 437,520
Prepaid pension asset .................................................... 568,055 586,712
Other .............................................................. 142,078 135,746
Noncurrent assets held for sale and related to discontinued operations ...................... 120,310 146,806
Total other assets ..................................................... 3,701,845 3,775,502
Total assets ....................................................... $23,184,727 $21,958,346
Liabilities and Equity
Current liabilities:
Current portion of long-term debt ............................................ $ 637,535 $ 336,411
Short-term debt ....................................................... 1,088,560 626,300
Accounts payable ....................................................... 1,079,345 1,101,270
Taxes accrued ......................................................... 240,443 252,384
Dividends payable ...................................................... 99,682 91,685
Derivative instruments valuation ............................................. 58,811 83,944
Other .............................................................. 419,209 347,809
Current liabilities held for sale and related to discontinued operations ...................... 17,539 25,478
Total current liabilities .................................................. 3,641,124 2,865,281
Deferred credits and other liabilities:
Deferred income taxes .................................................... 2,553,526 2,256,599
Deferred investment tax credits .............................................. 112,914 121,594
Regulatory liabilities ..................................................... 1,389,987 1,364,657
Asset retirement obligations ................................................ 1,315,144 1,361,951
Derivative instruments valuation ............................................. 384,419 483,077
Customer advances ...................................................... 305,239 302,168
Pension and employee benefit obligations ........................................ 576,426 704,913
Other .............................................................. 137,422 121,193
Noncurrent liabilities held for sale and related to discontinued operations .................... 20,384 5,473
Total deferred credits and other liabilities ...................................... 6,795,461 6,721,625
Commitments and contingent liabilities
Capitalization:
Long-term debt ........................................................ 6,342,160 6,449,638
Preferred stockholders’ equity ............................................... 104,980 104,980
Common stockholders’ equity ............................................... 6,301,002 5,816,822
Total liabilities and equity ................................................ $23,184,727 $21,958,346
74