Xcel Energy 2007 Annual Report Download - page 73
Download and view the complete annual report
Please find page 73 of the 2007 Xcel Energy annual report below. You can navigate through the pages in the report by either clicking on the pages listed below, or by using the keyword search tool below to find specific information within the annual report.-
 1
1 -
2
-
3
-
4
-
5
-
6
-
7
-
8
-
9
-
10
-
11
-
12
-
13
-
14
-
15
-
16
-
17
-
18
-
19
-
20
-
21
-
22
-
23
-
24
-
25
-
26
-
27
-
28
-
29
-
30
-
31
-
32
-
33
-
34
-
35
-
36
-
37
-
38
-
39
-
40
-
41
-
42
-
43
-
44
-
45
-
46
-
47
-
48
-
49
-
50
-
51
-
52
-
53
-
54
-
55
-
56
-
57
-
58
-
59
-
60
-
61
-
62
-
 63
63 -
 64
64 -
 65
65 -
 66
66 -
 67
67 -
 68
68 -
 69
69 -
 70
70 -
 71
71 -
 72
72 -
 73
73 -
 74
74 -
 75
75 -
 76
76 -
 77
77 -
 78
78 -
 79
79 -
 80
80 -
 81
81 -
 82
82 -
 83
83 -
84
-
85
-
86
-
87
-
88
-
89
-
90
-
91
-
92
-
93
-
94
-
95
-
96
-
97
-
98
-
99
-
100
-
101
-
102
-
103
-
104
-
105
-
106
-
107
-
108
-
109
-
110
-
111
-
112
-
113
-
114
-
115
-
116
-
117
-
118
-
119
-
120
-
121
-
122
-
123
-
124
-
125
-
126
-
127
-
128
-
129
-
130
-
131
-
132
-
133
-
134
-
135
-
136
-
137
-
138
-
139
-
140
-
141
-
142
-
143
-
144
-
145
-
146
-
147
-
148
-
149
-
150
-
151
-
152
-
153
-
154
-
155
-
156
 |
 |

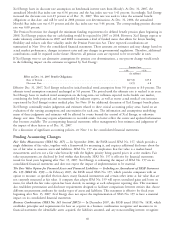
Credit Risk — Xcel Energy and its subsidiaries are also exposed to credit risk. Credit risk relates to the risk of loss
resulting from the nonperformance by a counterparty of its contractual obligations. Xcel Energy and its subsidiaries
maintain credit policies intended to minimize overall credit risk and actively monitor these policies to reflect changes
and scope of operations.
Xcel Energy and its subsidiaries conduct standard credit reviews for all counterparties. Xcel Energy employs additional
credit risk control mechanisms, such as letters of credit, parental guarantees, standardized master netting agreements and
termination provisions that allow for offsetting of positive and negative exposures. The credit exposure is monitored
and, when necessary, the activity with a specific counterparty is limited until credit enhancement is provided.
At Dec. 31, 2007, a 10-percent increase in prices would have resulted in a net mark-to-market increase in credit risk
exposure of $19.6 million, while a decrease of 10 percent would have resulted in a decrease of $12.0 million.
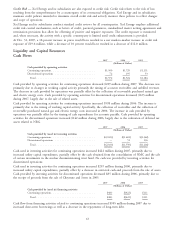
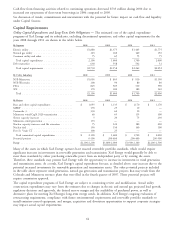
Liquidity and Capital Resources
Cash Flows
2007 2006 2005
(Millions of Dollars)
Cash provided by operating activities
Continuing operations .......................... $1,500 $1,729 $1,131
Discontinued operations ........................ 72 195 53
Total ................................... $1,572 $1,924 $1,184
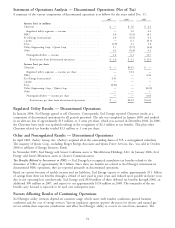
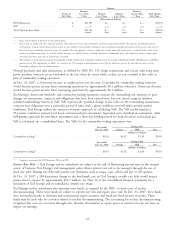
Cash provided by operating activities for continuing operations decreased $229 million during 2007. The decrease was
primarily due to changes in working capital activity primarily the timing of accounts receivables and unbilled revenues.
The decrease in cash provided by operations was partially offset by the collection of recoverable purchased natural gas
and electric energy costs. Cash provided by operating activities for discontinued operations decreased $123 million
during 2007, largely due to the sale of related assets.
Cash provided by operating activities for continuing operations increased $598 million during 2006. The increase is
primarily due to the timing of working capital activity. Specifically, the collection of receivables and the collection of
recoverable purchased natural gas and electric energy costs increased in 2006. The increase in cash provided by
operations was partially offset by the timing of cash expenditures for accounts payable. Cash provided by operating
activities for discontinued operations increased $142 million during 2006, largely due to the realization of deferred tax
assets related to NRG.
2007 2006 2005
(Millions of Dollars)
Cash provided by (used in) investing activities
Continuing operations .......................... $(2,023) $(1,601) $(1,362)
Discontinued operations ........................ — 51 136
Total ................................... $(2,023) $(1,550) $(1,226)
Cash used in investing activities for continuing operations increased $422 million during 2007, primarily due to
increased utility capital expenditures, partially offset by the cash obtained from the consolidation of NMC and the sale
of certain investments in the nuclear decommissioning trust fund. No cash was provided by investing activities for
discontinued operations.
Cash used in investing activities for continuing operations increased $239 million during 2006, primarily due to
increased utility capital expenditures, partially offset by a decrease in restricted cash and proceeds from the sale of assets.
Cash provided by investing activities for discontinued operations decreased $85 million during 2006, primarily due to
the receipt of proceeds from the sale of Cheyenne and Seren in 2005.
2007 2006 2005
(Millions of Dollars)
Cash provided by (used in) financing activities
Continuing operations .......................... $483 $(422) $111
Total ................................... $483 $(422) $111
Cash flow from financing activities related to continuing operations increased $905 million during 2007 due to
increased short-term borrowings as well as a decrease in the repayments of long-term debt.
63