Xcel Energy 2007 Annual Report Download - page 140
Download and view the complete annual report
Please find page 140 of the 2007 Xcel Energy annual report below. You can navigate through the pages in the report by either clicking on the pages listed below, or by using the keyword search tool below to find specific information within the annual report.-
 1
1 -
2
-
3
-
4
-
5
-
6
-
7
-
8
-
9
-
10
-
11
-
12
-
13
-
14
-
15
-
16
-
17
-
18
-
19
-
20
-
21
-
22
-
23
-
24
-
25
-
26
-
27
-
28
-
29
-
30
-
31
-
32
-
33
-
34
-
35
-
36
-
37
-
38
-
39
-
40
-
41
-
42
-
43
-
44
-
45
-
46
-
47
-
48
-
49
-
50
-
51
-
52
-
53
-
54
-
55
-
56
-
57
-
58
-
59
-
60
-
61
-
62
-
63
-
64
-
65
-
66
-
67
-
68
-
69
-
70
-
71
-
72
-
73
-
74
-
75
-
76
-
77
-
78
-
79
-
80
-
81
-
82
-
83
-
84
-
85
-
86
-
87
-
88
-
89
-
90
-
91
-
92
-
93
-
94
-
95
-
96
-
97
-
98
-
99
-
100
-
101
-
102
-
103
-
104
-
105
-
106
-
107
-
108
-
109
-
110
-
111
-
112
-
113
-
114
-
115
-
116
-
117
-
118
-
119
-
120
-
121
-
122
-
123
-
124
-
125
-
126
-
127
-
128
-
129
-
 130
130 -
 131
131 -
 132
132 -
 133
133 -
 134
134 -
 135
135 -
 136
136 -
 137
137 -
 138
138 -
 139
139 -
 140
140 -
 141
141 -
 142
142 -
 143
143 -
 144
144 -
 145
145 -
 146
146 -
 147
147 -
 148
148 -
 149
149 -
 150
150 -
151
-
152
-
153
-
154
-
155
-
156
 |
 |

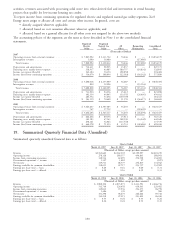
activities, revenues associated with processing solid waste into refuse-derived fuel and investments in rental housing
projects that qualify for low-income housing tax credits.
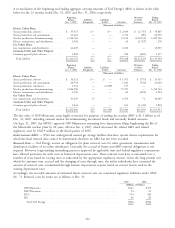
To report income from continuing operations for regulated electric and regulated natural gas utility segments, Xcel
Energy must assign or allocate all costs and certain other income. In general, costs are:
• directly assigned wherever applicable;
• allocated based on cost causation allocators wherever applicable; and
• allocated based on a general allocator for all other costs not assigned by the above two methods.
The accounting policies of the segments are the same as those described in Note 1 to the consolidated financial
statements. Regulated Regulated
Electric Natural Gas All Reconciling Consolidated
Utility Utility Other Eliminations Total
(Thousands of Dollars)
2007
Operating revenues from external customers ............. $7,847,992 $ 2,111,732 $ 74,446 $ — $ 10,034,170
Intersegment revenues .......................... 1,000 16,680 — (17,680) —
Total revenues ............................. $7,848,992 $ 2,128,412 $ 74,446 $ (17,680) $ 10,034,170
Depreciation and amortization ..................... $ 714,411 $ 98,925 $ 13,837 $ — $ 827,173
Financing costs, mainly interest expense ................ 318,937 43,985 180,757 (14,834) 528,845
Income tax expense (benefit) ...................... 343,184 50,150 (98,850) — 294,484
Income (loss) from continuing operations ............... $ 554,670 $ 108,054 $ (22,583) $ (64,242) $ 575,899
2006
Operating revenues from external customers ............. $7,608,018 $ 2,155,999 $ 76,287 $ — $ 9,840,304
Intersegment revenues .......................... 820 12,296 — (13,116) —
Total revenues ............................. $7,608,838 $ 2,168,295 $ 76,287 $ (13,116) $ 9,840,304
Depreciation and amortization ..................... $ 711,930 $ 94,356 $ 15,612 $ — $ 821,898
Financing costs, mainly interest expense ................ 302,114 44,965 133,558 (24,605) 456,032
Income tax expense (benefit) ...................... 283,552 37,656 (139,797) — 181,411
Income (loss) from continuing operations ............... $ 503,119 $ 70,609 $ 51,570 $ (56,617) $ 568,681
2005
Operating revenues from external customers ............. $7,243,637 $ 2,307,385 $ 74,455 $ — $ 9,625,477
Intersegment revenues .......................... 767 17,732 — (18,499) —
Total revenues ............................. $7,244,404 $ 2,325,117 $ 74,455 $ (18,499) $ 9,625,477
Depreciation and amortization ..................... $ 662,236 $ 89,174 $ 15,911 $ — $ 767,321
Financing costs, mainly interest expense ................ 301,185 47,145 108,538 (14,242) 442,626
Income tax expense (benefit) ...................... 258,161 32,923 (117,545) — 173,539
Income (loss) from continuing operations ............... $ 440,578 $ 71,213 $ 35,733 $ (48,486) $ 499,038
19. Summarized Quarterly Financial Data (Unaudited)
Summarized quarterly unaudited financial data is as follows:
Quarter Ended
March 31, 2007 June 30, 2007 Sept. 30, 2007 Dec. 31, 2007
(Thousands of Dollars, except per share amounts)
Revenue ......................................... $2,763,662 $2,267,292 $2,399,997 $2,603,219
Operating income ................................... 278,128 289,157 494,845 288,941
Income from continuing operations ......................... 118,514 67,695 254,720 134,969
Discontinued operations — income ......................... 1,197 1,082 97 (927)
Net income ....................................... 119,711 68,777 254,817 134,042
Earnings available for common shareholders .................... 118,651 67,717 253,757 132,982
Earnings per share total — basic ........................... $ 0.29 $ 0.16 $ 0.60 $ 0.31
Earnings per share total — diluted .......................... 0.28 0.16 0.59 0.31
Quarter Ended
March 31, 2006 June 30, 2006 Sept. 30, 2006 Dec. 31, 2006
(Thousands of Dollars, except per share amounts)
Revenue ......................................... $2,888,104 $ 2,073,873 $ 2,411,591 $ 2,466,736
Operating income ................................... 312,749 224,658 410,103 229,482
Income from continuing operations ......................... 149,812 97,936 224,175 96,758
Discontinued operations — income ......................... 1,486 339 287 960
Net income ....................................... 151,298 98,275 224,462 97,718
Earnings available for common shareholders .................... 150,238 97,215 223,402 96,658
Earnings per share total — basic ........................... $ 0.37 $ 0.24 $ 0.55 $ 0.24
Earnings per share total — diluted .......................... 0.36 0.24 0.53 0.23
130