Xcel Energy 2007 Annual Report Download - page 83
Download and view the complete annual report
Please find page 83 of the 2007 Xcel Energy annual report below. You can navigate through the pages in the report by either clicking on the pages listed below, or by using the keyword search tool below to find specific information within the annual report.-
 1
1 -
2
-
3
-
4
-
5
-
6
-
7
-
8
-
9
-
10
-
11
-
12
-
13
-
14
-
15
-
16
-
17
-
18
-
19
-
20
-
21
-
22
-
23
-
24
-
25
-
26
-
27
-
28
-
29
-
30
-
31
-
32
-
33
-
34
-
35
-
36
-
37
-
38
-
39
-
40
-
41
-
42
-
43
-
44
-
45
-
46
-
47
-
48
-
49
-
50
-
51
-
52
-
53
-
54
-
55
-
56
-
57
-
58
-
59
-
60
-
61
-
62
-
63
-
64
-
65
-
66
-
67
-
68
-
69
-
70
-
71
-
72
-
 73
73 -
 74
74 -
 75
75 -
 76
76 -
 77
77 -
 78
78 -
 79
79 -
 80
80 -
 81
81 -
 82
82 -
 83
83 -
 84
84 -
 85
85 -
 86
86 -
 87
87 -
 88
88 -
 89
89 -
 90
90 -
 91
91 -
 92
92 -
 93
93 -
94
-
95
-
96
-
97
-
98
-
99
-
100
-
101
-
102
-
103
-
104
-
105
-
106
-
107
-
108
-
109
-
110
-
111
-
112
-
113
-
114
-
115
-
116
-
117
-
118
-
119
-
120
-
121
-
122
-
123
-
124
-
125
-
126
-
127
-
128
-
129
-
130
-
131
-
132
-
133
-
134
-
135
-
136
-
137
-
138
-
139
-
140
-
141
-
142
-
143
-
144
-
145
-
146
-
147
-
148
-
149
-
150
-
151
-
152
-
153
-
154
-
155
-
156
 |
 |

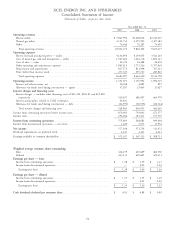
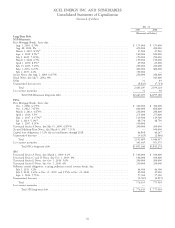
XCEL ENERGY INC. AND SUBSIDIARIES
Consolidated Statements of Cash Flows
(thousands of dollars)
Year ended Dec. 31
2007 2006 2005
Operating activities
Net income ................................................. $ 577,348 $ 571,754 $ 512,972
Remove income from discontinued operations ............................ (1,449) (3,073) (13,934)
Adjustments to reconcile net income to cash provided by operating activities:
Depreciation and amortization .................................... 855,897 857,129 782,074
Nuclear fuel amortization ....................................... 53,453 47,531 45,330
Deferred income taxes ......................................... 265,277 (59,843) 205,058
Amortization of investment tax credits ............................... (8,680) (9,806) (11,620)
Allowance for equity funds used during construction ...................... (37,207) (25,045) (21,627)
Undistributed equity in earnings of unconsolidated affiliates .................. (1,900) (2,775) (712)
Gain or write down of assets sold or held for sale ........................ — (6,189) 2,887
Share-based compensation expense .................................. 22,871 40,384 27,598
Net realized and unrealized hedging and derivative transactions ................ 6,463 (27,219) 9,715
Changes in operating assets and liabilities (net of effects of consolidation of NMC)
Accounts receivable .......................................... (79,373) 176,732 (250,305)
Accrued unbilled revenues ..................................... (217,659) 99,716 (178,585)
Inventories ............................................... (25,464) 28,967 (94,605)
Recoverable purchased natural gas and electric energy costs ................. 185,185 136,470 (130,442)
Other current assets ......................................... (9,922) (1,831) 2,002
Accounts payable ........................................... (10,018) (105,707) 281,430
Net regulatory assets and liabilities ................................ 27,428 (34,211) (20,433)
Other current liabilities ....................................... 52,771 97,216 15,927
Change in other noncurrent assets .................................. (56,053) 4,956 (39,995)
Change in other noncurrent liabilities ................................ (99,098) (56,415) 7,699
Operating cash flows provided by discontinued operations ..................... 72,346 195,255 53,283
Net cash provided by operating activities ............................ 1,572,216 1,923,996 1,183,717
Investing activities
Utility capital/construction expenditures .............................. (2,095,721) (1,626,000) (1,304,468)
Allowance for equity funds used during construction ...................... 37,207 25,045 21,627
Purchase of investments in external decommissioning fund ................... (712,462) (1,288,103) (576,001)
Proceeds from the sale of investments in external decommissioning fund .......... 669,070 1,240,034 494,529
Nonregulated capital expenditures and asset acquisitions .................... (1,136) (1,620) (6,976)
Proceeds from sale of assets ...................................... — 24,670 11,228
Investment in WYCO ......................................... 29,659 — —
Change in restricted cash ....................................... (9,190) 11,813 (6,226)
Cash obtained from consolidation of NMC ............................ 38,950 — —
Other investments ............................................ 20,832 13,535 5,075
Investing cash flows provided by discontinued operations ..................... — 50,516 135,577
Net cash used in investing activities ............................... (2,022,791) (1,550,110) (1,225,635)
Financing activities
Proceeds from (repayment of) short-term borrowings — net .................. 462,260 (119,820) 433,820
Proceeds from issuance of long-term debt ............................. 1,162,272 1,326,180 2,529,408
Repayment of long-term debt, including reacquisition premiums ............... (768,146) (1,285,584) (2,517,698)
Proceeds from issuance of common stock ............................. 10,539 16,275 9,085
Dividends paid .............................................. (378,892) (358,746) (343,092)
Early participation payment on debt exchange .......................... (4,859) — —
Financing cash flows used in discontinued operations ........................ — — (200)
Net cash (used in) provided by financing activities ...................... 483,174 (421,695) 111,323
Net increase (decrease) in cash and cash equivalents ......................... 32,599 (47,809) 69,405
Net increase (decrease) in cash and cash equivalents — discontinued operations ....... (18,937) 13,071 (20,570)
Cash and cash equivalents at beginning of year ........................... 37,458 72,196 23,361
Cash and cash equivalents at end of year ............................... $ 51,120 $ 37,458 $ 72,196
Supplemental disclosure of cash flow information
Cash paid for interest (net of amounts capitalized) ........................ $ 469,142 $ 427,683 $ 417,016
Cash paid for income taxes (net of refunds received) ...................... 6,467 (13,329) 10,625
Supplemental disclosure of non-cash investing transactions:
Property, plant and equipment additions in accounts payable ................. $ 39,681 $ 54,102 $ 42,526
Supplemental disclosure of non-cash financing transactions:
Issuance of common stock for reinvested dividends and 401(k) plans ............ $ 53,105 $ 56,194 $ 43,882
Issuance of common stock for senior convertible notes ..................... 229,623 — —
73