Xcel Energy 2007 Annual Report Download - page 150
Download and view the complete annual report
Please find page 150 of the 2007 Xcel Energy annual report below. You can navigate through the pages in the report by either clicking on the pages listed below, or by using the keyword search tool below to find specific information within the annual report.-
 1
1 -
2
-
3
-
4
-
5
-
6
-
7
-
8
-
9
-
10
-
11
-
12
-
13
-
14
-
15
-
16
-
17
-
18
-
19
-
20
-
21
-
22
-
23
-
24
-
25
-
26
-
27
-
28
-
29
-
30
-
31
-
32
-
33
-
34
-
35
-
36
-
37
-
38
-
39
-
40
-
41
-
42
-
43
-
44
-
45
-
46
-
47
-
48
-
49
-
50
-
51
-
52
-
53
-
54
-
55
-
56
-
57
-
58
-
59
-
60
-
61
-
62
-
63
-
64
-
65
-
66
-
67
-
68
-
69
-
70
-
71
-
72
-
73
-
74
-
75
-
76
-
77
-
78
-
79
-
80
-
81
-
82
-
83
-
84
-
85
-
86
-
87
-
88
-
89
-
90
-
91
-
92
-
93
-
94
-
95
-
96
-
97
-
98
-
99
-
100
-
101
-
102
-
103
-
104
-
105
-
106
-
107
-
108
-
109
-
110
-
111
-
112
-
113
-
114
-
115
-
116
-
117
-
118
-
119
-
120
-
121
-
122
-
123
-
124
-
125
-
126
-
127
-
128
-
129
-
130
-
131
-
132
-
133
-
134
-
135
-
136
-
137
-
138
-
139
-
 140
140 -
 141
141 -
 142
142 -
 143
143 -
 144
144 -
 145
145 -
 146
146 -
 147
147 -
 148
148 -
 149
149 -
 150
150 -
 151
151 -
 152
152 -
 153
153 -
 154
154 -
 155
155 -
 156
156
 |
 |

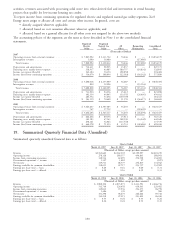
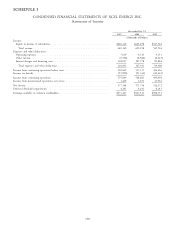
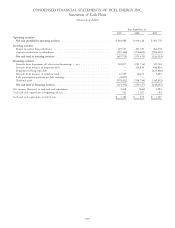
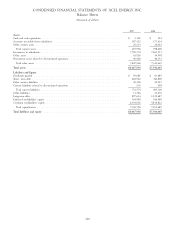
CONDENSED FINANCIAL STATEMENTS OF XCEL ENERGY INC.
Balance Sheets
(thousands of dollars)
2007 2006
Assets
Cash and cash equivalents .............................................. $ 3,161 $ 523
Accounts receivable from subsidiaries ........................................ 187,522 171,434
Other current assets .................................................. 29,313 26,443
Total current assets ................................................. 219,996 198,400
Investment in subsidiaries .............................................. 7,790,574 7,261,515
Other assets ....................................................... 16,926 39,998
Noncurrent assets related to discontinued operations .............................. 40,460 40,152
Total other assets .................................................. 7,847,960 7,341,665
Total assets ....................................................... $8,067,956 $7,540,065
Liabilities and Equity
Dividends payable ................................................... $ 99,681 $ 91,685
Short- term debt .................................................... 602,962 343,800
Other current liabilities ................................................ 49,396 29,257
Current liabilities related to discontinued operations .............................. 535 358
Total current liabilities ............................................... 752,574 465,100
Other liabilities ..................................................... 11,786 23,476
Long-term debt ..................................................... 897,614 1,129,687
Preferred stockholders’ equity ............................................ 104,980 104,980
Common stockholders’ equity ............................................ 6,301,002 5,816,822
Total capitalization ................................................. 7,303,596 7,051,489
Total liabilities and equity .............................................. $8,067,956 $7,540,065
140