Xcel Energy 2007 Annual Report Download - page 110
Download and view the complete annual report
Please find page 110 of the 2007 Xcel Energy annual report below. You can navigate through the pages in the report by either clicking on the pages listed below, or by using the keyword search tool below to find specific information within the annual report.-
 1
1 -
2
-
3
-
4
-
5
-
6
-
7
-
8
-
9
-
10
-
11
-
12
-
13
-
14
-
15
-
16
-
17
-
18
-
19
-
20
-
21
-
22
-
23
-
24
-
25
-
26
-
27
-
28
-
29
-
30
-
31
-
32
-
33
-
34
-
35
-
36
-
37
-
38
-
39
-
40
-
41
-
42
-
43
-
44
-
45
-
46
-
47
-
48
-
49
-
50
-
51
-
52
-
53
-
54
-
55
-
56
-
57
-
58
-
59
-
60
-
61
-
62
-
63
-
64
-
65
-
66
-
67
-
68
-
69
-
70
-
71
-
72
-
73
-
74
-
75
-
76
-
77
-
78
-
79
-
80
-
81
-
82
-
83
-
84
-
85
-
86
-
87
-
88
-
89
-
90
-
91
-
92
-
93
-
94
-
95
-
96
-
97
-
98
-
99
-
 100
100 -
 101
101 -
 102
102 -
 103
103 -
 104
104 -
 105
105 -
 106
106 -
 107
107 -
 108
108 -
 109
109 -
 110
110 -
 111
111 -
 112
112 -
 113
113 -
 114
114 -
 115
115 -
 116
116 -
 117
117 -
 118
118 -
 119
119 -
 120
120 -
121
-
122
-
123
-
124
-
125
-
126
-
127
-
128
-
129
-
130
-
131
-
132
-
133
-
134
-
135
-
136
-
137
-
138
-
139
-
140
-
141
-
142
-
143
-
144
-
145
-
146
-
147
-
148
-
149
-
150
-
151
-
152
-
153
-
154
-
155
-
156
 |
 |

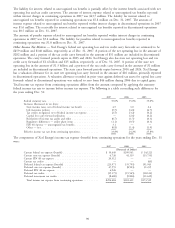
The actual composition of postretirement benefit plan assets at Dec. 31 was:
2007 2006
Equity and equity mutual fund securities ................................. 67% 67%
Fixed income/debt securities ......................................... 21 21
Cash equivalents ................................................ 11 11
Nontraditional investments ......................................... 1 1
100% 100%
Xcel Energy bases its investment-return assumption for the postretirement health care fund assets on expected long-term
performance for each of the investment types included in its postretirement health care asset portfolio. Investment-
return volatility is not considered to be a material factor in postretirement health care costs.
Benefit Obligations — A comparison of the actuarially computed benefit obligation and plan assets for Xcel Energy
postretirement health care plans that benefit employees of its utility subsidiaries is presented in the following table:
2007 2006
(Thousands of Dollars)
Change in Benefit Obligation
Obligation at Jan. 1 .................................................... $918,693 $ 938,172
Service cost ......................................................... 5,813 6,633
Interest cost ......................................................... 50,475 52,939
Medicare subsidy reimbursements ............................................ 2,526 3,561
Plan amendments ...................................................... — (945)
Plan participants’ contributions ............................................. 13,211 11,870
Actuarial gain ........................................................ (86,576) (27,511)
Benefit payments ...................................................... (73,827) (66,026)
Obligation at Dec. 31 ................................................... $830,315 $ 918,693
Change in Fair Value of Plan Assets
Fair value of plan assets at Jan. 1 ............................................ $406,305 $ 351,863
Actual return on plan assets ............................................... 24,623 41,409
Plan participants’ contributions ............................................. 13,211 11,870
Employer contributions .................................................. 57,147 67,188
Benefit payments ...................................................... (73,827) (66,025)
Fair value of plan assets at Dec. 31 ........................................... $427,459 $ 406,305
Funded Status at Dec. 31
Funded status ........................................................ $(402,856) $(512,388)
Current liabilities ...................................................... (1,755) (2,211)
Noncurrent liabilities ................................................... (401,101) (510,177)
Net amounts recognized on consolidated balance sheets .............................. $(402,856) $(512,388)
Amounts Not Yet Recognized as Components of Net Periodic Benefit Cost:
Net loss ............................................................ $202,748 $ 297,745
Prior service credit ..................................................... (11,380) (13,558)
Transition obligation .................................................... 73,056 87,633
Total ............................................................. $264,424 $ 371,820
SFAS No. 158 Amounts Have Been Recorded as Follows Based upon Expected Recovery in Rates:
Regulatory assets ...................................................... $154,661 $ 235,834
Regulatory liabilities .................................................... 97,835 118,722
Deferred income taxes ................................................... 5,184 7,004
Net-of-tax AOCI ...................................................... 6,744 10,260
Total ............................................................. $264,424 $ 371,820
Measurement Date ..................................................... Dec. 31, 2007 Dec. 31, 2006
Significant Assumptions Used to Measure Benefit Obligations
Discount rate for year-end valuation .......................................... 6.25% 6.00%
Effective Dec. 31, 2007, Xcel Energy reduced its initial medical trend assumption from 9.0 percent to 8.0 percent. The
ultimate trend assumption remained unchanged at 5.0 percent. The period until the ultimate rate is reached is six years.
Xcel Energy bases its medical trend assumption on the long-term cost inflation expected in the health care market,
considering the levels projected and recommended by industry experts, as well as recent actual medical cost increases
experienced by Xcel Energy’s retiree medical plan.
100