Xcel Energy 2007 Annual Report Download - page 74
Download and view the complete annual report
Please find page 74 of the 2007 Xcel Energy annual report below. You can navigate through the pages in the report by either clicking on the pages listed below, or by using the keyword search tool below to find specific information within the annual report.-
 1
1 -
2
-
3
-
4
-
5
-
6
-
7
-
8
-
9
-
10
-
11
-
12
-
13
-
14
-
15
-
16
-
17
-
18
-
19
-
20
-
21
-
22
-
23
-
24
-
25
-
26
-
27
-
28
-
29
-
30
-
31
-
32
-
33
-
34
-
35
-
36
-
37
-
38
-
39
-
40
-
41
-
42
-
43
-
44
-
45
-
46
-
47
-
48
-
49
-
50
-
51
-
52
-
53
-
54
-
55
-
56
-
57
-
58
-
59
-
60
-
61
-
62
-
63
-
 64
64 -
 65
65 -
 66
66 -
 67
67 -
 68
68 -
 69
69 -
 70
70 -
 71
71 -
 72
72 -
 73
73 -
 74
74 -
 75
75 -
 76
76 -
 77
77 -
 78
78 -
 79
79 -
 80
80 -
 81
81 -
 82
82 -
 83
83 -
 84
84 -
85
-
86
-
87
-
88
-
89
-
90
-
91
-
92
-
93
-
94
-
95
-
96
-
97
-
98
-
99
-
100
-
101
-
102
-
103
-
104
-
105
-
106
-
107
-
108
-
109
-
110
-
111
-
112
-
113
-
114
-
115
-
116
-
117
-
118
-
119
-
120
-
121
-
122
-
123
-
124
-
125
-
126
-
127
-
128
-
129
-
130
-
131
-
132
-
133
-
134
-
135
-
136
-
137
-
138
-
139
-
140
-
141
-
142
-
143
-
144
-
145
-
146
-
147
-
148
-
149
-
150
-
151
-
152
-
153
-
154
-
155
-
156
 |
 |

Cash flow from financing activities related to continuing operations decreased $533 million during 2006 due to
increased net repayments of short-term borrowings in 2006 compared to 2005.
See discussion of trends, commitments and uncertainties with the potential for future impact on cash flow and liquidity
under Capital Sources.
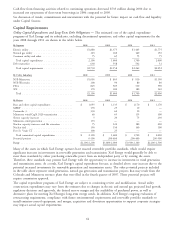
Capital Requirements
Utility Capital Expenditures and Long-Term Debt Obligations — The estimated cost of the capital expenditure
programs of Xcel Energy and its subsidiaries, excluding discontinued operations, and other capital requirements for the
years 2008 through 2011 are shown in the tables below.
By Segment 2008 2009 2010 2011
Electric utility .......................... $1,880 $1,375 $1,465 $1,775
Natural gas utility ....................... 145 160 160 150
Common utility and other .................. 75 65 75 75
Total capital expenditures ................. 2,100 1,600 1,700 2,000
Debt maturities ......................... 638 558 542 52
Total capital requirements ................. $2,738 $2,158 $2,242 $2,052
By Utility Subsidiary 2008 2009 2010 2011
NSP-Minnesota ......................... $1,005 $ 805 $ 910 $1,190
NSP-Wisconsin ......................... 100 90 80 80
PSCo ............................... 825 505 530 590
SPS ................................ 170 200 180 140
Total .............................. $2,100 $1,600 $1,700 $2,000
By Project 2008 2009 2010 2011
Base and other capital expenditures ............. $ 1,095 $ 1,135 $ 1,170 $ 1,170
MERP .............................. 170 25 10 —
Comanche 3 ........................... 330 60 10 —
Minnesota wind/CapX 2020 transmission ......... 40 65 115 300
Sherco capacity increases ................... 5 20 75 230
Minnesota wind generation .................. 135 — — —
Nuclear capacity increases and life extension ....... 75 120 180 200
Nuclear fuel ........................... 150 150 140 100
Fort St. Vrain CT ....................... 100 25 — —
Total committed capital expenditures .......... $ 2,100 $ 1,600 $ 1,700 $ 2,000
Potential projects ........................ 0-100 200-400 200-400 200-500
Range ............................... $2,100-2,200 $1,800-2,000 $1,900-2,100 $2,200-2,500
Many of the states in which Xcel Energy operates have enacted renewable portfolio standards, which would require
significant increases in investment in renewable generation and transmission. Xcel Energy would generally be able to
meet these standards by either purchasing renewable power from an independent party or by owning the assets.
Therefore, these standards may present Xcel Energy with the opportunity to increase its investment in wind generation
and transmission assets. As a result, Xcel Energy’s capital expenditure forecast, as detailed above, may increase due to the
potential increased investments for renewable generation and transmission assets. The other potential projects included
in the table above represent wind generation, natural gas generation and transmission projects that may result from the
Colorado and Minnesota resource plans that were filed in the fourth quarter of 2007. These potential projects will
require commission approval.
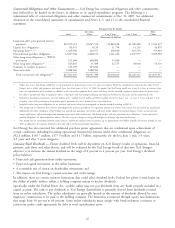
The capital expenditure programs of Xcel Energy are subject to continuing review and modification. Actual utility
construction expenditures may vary from the estimates due to changes in electric and natural gas projected load growth,
regulatory decisions and approvals, the desired reserve margin and the availability of purchased power, as well as
alternative plans for meeting Xcel Energy’s long-term energy needs. In addition, Xcel Energy’s ongoing evaluation of
restructuring requirements, compliance with future environmental requirements and renewable portfolio standards to
install emission-control equipment, and merger, acquisition and divestiture opportunities to support corporate strategies
may impact actual capital requirements.
64