Xcel Energy 2007 Annual Report Download - page 56
Download and view the complete annual report
Please find page 56 of the 2007 Xcel Energy annual report below. You can navigate through the pages in the report by either clicking on the pages listed below, or by using the keyword search tool below to find specific information within the annual report.-
 1
1 -
2
-
3
-
4
-
5
-
6
-
7
-
8
-
9
-
10
-
11
-
12
-
13
-
14
-
15
-
16
-
17
-
18
-
19
-
20
-
21
-
22
-
23
-
24
-
25
-
26
-
27
-
28
-
29
-
30
-
31
-
32
-
33
-
34
-
35
-
36
-
37
-
38
-
39
-
40
-
41
-
42
-
43
-
44
-
45
-
 46
46 -
 47
47 -
 48
48 -
 49
49 -
 50
50 -
 51
51 -
 52
52 -
 53
53 -
 54
54 -
 55
55 -
 56
56 -
 57
57 -
 58
58 -
 59
59 -
 60
60 -
 61
61 -
 62
62 -
 63
63 -
 64
64 -
 65
65 -
 66
66 -
67
-
68
-
69
-
70
-
71
-
72
-
73
-
74
-
75
-
76
-
77
-
78
-
79
-
80
-
81
-
82
-
83
-
84
-
85
-
86
-
87
-
88
-
89
-
90
-
91
-
92
-
93
-
94
-
95
-
96
-
97
-
98
-
99
-
100
-
101
-
102
-
103
-
104
-
105
-
106
-
107
-
108
-
109
-
110
-
111
-
112
-
113
-
114
-
115
-
116
-
117
-
118
-
119
-
120
-
121
-
122
-
123
-
124
-
125
-
126
-
127
-
128
-
129
-
130
-
131
-
132
-
133
-
134
-
135
-
136
-
137
-
138
-
139
-
140
-
141
-
142
-
143
-
144
-
145
-
146
-
147
-
148
-
149
-
150
-
151
-
152
-
153
-
154
-
155
-
156
 |
 |

• Utility Engineering Corp., which was sold in April 2005;
• Seren, a portion of which was sold in November 2005 with the remainder sold in January 2006;
• Cheyenne, which was sold in January 2005;
• NRG, which emerged from bankruptcy and was divested in late 2003; and
• Xcel Energy International and e prime Inc. (e prime), which were classified as held for sale in late 2003 based
on the decision to divest them.
See Note 3 to the consolidated financial statements for a further discussion of discontinued operations.
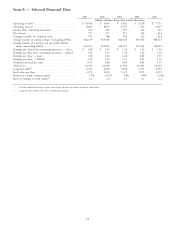
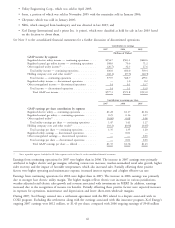
Contribution to earnings
2007 2006 2005
(Millions of Dollars)
GAAP income by segment
Regulated electric utility income — continuing operations .... $554.7 $503.1 $440.6
Regulated natural gas utility income — continuing operations . 108.0 70.6 71.2
Other regulated utility income(a) .................... (26.7) 32.3 27.6
Total utility income — continuing operations .......... 636.0 606.0 539.4
Holding company costs and other results(a) ............. (60.1) (37.3) (40.3)
Total income — continuing operations .............. 575.9 568.7 499.1
Regulated utility income — discontinued operations ....... — 3.0 0.2
Other nonregulated income — discontinued operations ..... 1.4 0.1 13.7
Total income — discontinued operations ............. 1.4 3.1 13.9
Total GAAP net income ...................... $577.3 $571.8 $513.0
Contribution to earnings per share
2007 2006 2005
GAAP earnings per share contribution by segment
Regulated electric utility — continuing operations ......... $1.28 $1.17 $1.04
Regulated natural gas utility — continuing operations ...... 0.25 0.16 0.17
Other regulated utility(a) ......................... (0.06) 0.08 0.06
Total utility earnings per share — continuing operations . . . 1.47 1.41 1.27
Holding company costs and other results(a) ............. (0.12) (0.06) (0.07)
Total earnings per share — continuing operations ........ 1.35 1.35 1.20
Regulated utility earnings — discontinued operations ....... — 0.01 —
Other nonregulated earnings — discontinued operations ..... — — 0.03
Total earnings per share — discontinued operations ...... — 0.01 0.03
Total GAAP earnings per share — diluted ........... $1.35 $1.36 $1.23
(a) Not a reportable segment. Included in All Other segment results in Note 18 to the consolidated financial statements.
Earnings from continuing operations for 2007 were higher than in 2006. The increase in 2007 earnings were primarily
attributed to higher electric and gas margins, reflecting various rate increases, weather-normalized retail sales growth, higher
rider recovery, and the impact of favorable temperatures, which also increased sales. Partially offsetting these positive
factors were higher operating and maintenance expense, increased interest expense and a higher effective tax rate.
Earnings from continuing operations for 2006 were higher than in 2005. The increase in 2006 earnings was primarily
due to stronger base electric utility margin. The higher margin reflects electric rate increases in various jurisdictions,
weather-adjusted retail electric sales growth and revenue associated with investments in MERP. In addition, earnings
increased due to the recognition of income tax benefits. Partially offsetting these positive factors were expected increases
in expenses for operations, maintenance and depreciation and lower short-term wholesale margins.
During 2007, Xcel Energy entered into a settlement agreement with the IRS related to a dispute associated with its
COLI program. Excluding this settlement, along with the earnings associated with this insurance program, Xcel Energy’s
ongoing 2007 earnings were $612 million, or $1.43 per share, compared with 2006 ongoing earnings of $548 million
46