Xcel Energy 2007 Annual Report Download - page 102
Download and view the complete annual report
Please find page 102 of the 2007 Xcel Energy annual report below. You can navigate through the pages in the report by either clicking on the pages listed below, or by using the keyword search tool below to find specific information within the annual report.-
 1
1 -
2
-
3
-
4
-
5
-
6
-
7
-
8
-
9
-
10
-
11
-
12
-
13
-
14
-
15
-
16
-
17
-
18
-
19
-
20
-
21
-
22
-
23
-
24
-
25
-
26
-
27
-
28
-
29
-
30
-
31
-
32
-
33
-
34
-
35
-
36
-
37
-
38
-
39
-
40
-
41
-
42
-
43
-
44
-
45
-
46
-
47
-
48
-
49
-
50
-
51
-
52
-
53
-
54
-
55
-
56
-
57
-
58
-
59
-
60
-
61
-
62
-
63
-
64
-
65
-
66
-
67
-
68
-
69
-
70
-
71
-
72
-
73
-
74
-
75
-
76
-
77
-
78
-
79
-
80
-
81
-
82
-
83
-
84
-
85
-
86
-
87
-
88
-
89
-
90
-
91
-
 92
92 -
 93
93 -
 94
94 -
 95
95 -
 96
96 -
 97
97 -
 98
98 -
 99
99 -
 100
100 -
 101
101 -
 102
102 -
 103
103 -
 104
104 -
 105
105 -
 106
106 -
 107
107 -
 108
108 -
 109
109 -
 110
110 -
 111
111 -
 112
112 -
113
-
114
-
115
-
116
-
117
-
118
-
119
-
120
-
121
-
122
-
123
-
124
-
125
-
126
-
127
-
128
-
129
-
130
-
131
-
132
-
133
-
134
-
135
-
136
-
137
-
138
-
139
-
140
-
141
-
142
-
143
-
144
-
145
-
146
-
147
-
148
-
149
-
150
-
151
-
152
-
153
-
154
-
155
-
156
 |
 |

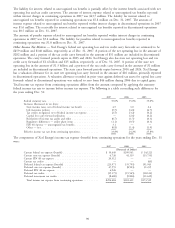
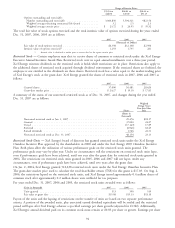
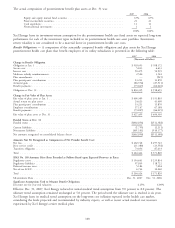
In 2007, 2006 and 2005, Xcel Energy had approximately 8.5 million, 11.0 million and 13.3 million options
outstanding, respectively, that were antidilutive and, therefore, excluded from the earnings per share calculation. The
dilutive impact of common stock equivalents affected earnings per share as follows for the years ending Dec. 31:
2007 2006 2005
Per Per Per
Share Share Share
Income Shares Amount Income Shares Amount Income Shares Amount
(Shares and dollars in thousands, except per share amounts)
Income from continuing
operations .............. $575,899 $568,681 $499,038
Less: Dividend requirements on
preferred stock ........... (4,241) (4,241) (4,241)
Basic earnings per share
Income from continuing
operations .............. 571,658 416,139 $1.38 564,440 405,689 $1.39 494,797 402,330 $1.23
Effect of dilutive securities:
Convertible debt .......... 10,411 16,425 15,112 23,317 14,373 23,317
401(k) equity awards ....... — 482 — 551 — —
Options ............... — 85 — 48 — 24
Diluted earnings per share
Income from continuing
operations and assumed
conversions ............. $582,069 433,131 $1.35 $579,552 429,605 $1.35 $509,170 425,671 $1.20
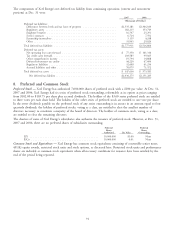
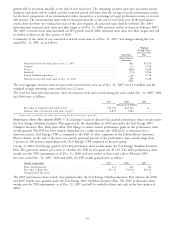
Common Stock Dividends Per Share — Historically, Xcel Energy has paid quarterly dividends to its shareholders.
Dividends on common stock are paid as declared by the board of directors. Dividends declared per share for the
quarters of 2007, 2006 and 2005 are:
Dividends Per Share 2007 2006 2005
First Quarter .................................... $0.2225 $0.2150 $0.2075
Second Quarter .................................. 0.2300 0.2225 0.2150
Third Quarter ................................... 0.2300 0.2225 0.2150
Fourth Quarter .................................. 0.2300 0.2225 0.2150
$0.9125 $0.8825 $0.8525
Dividend and Other Capital-Related Restrictions — The Articles of Incorporation of Xcel Energy place restrictions on
the amount of common stock dividends it can pay when preferred stock is outstanding. Under the provisions, dividend
payments may be restricted if Xcel Energy’s capitalization ratio (on a holding company basis only and not on a
consolidated basis) is less than 25 percent. For these purposes, the capitalization ratio is equal to (i) common stock plus
surplus divided by (ii) the sum of common stock plus surplus plus long-term debt. Based on this definition, the
capitalization ratio at Dec. 31, 2007 and 2006, was 85 percent and 81 percent, respectively. Therefore, the restrictions
do not place any effective limit on Xcel Energy’s ability to pay dividends because the restrictions are only triggered
when the capitalization ratio is less than 25 percent or will be reduced to less than 25 percent through dividends (other
than dividends payable in common stock), distributions or acquisitions of Xcel Energy common stock.
In addition, NSP-Minnesota’s first mortgage indenture places certain restrictions on the amount of cash dividends it can
pay to Xcel Energy, the holder of its common stock. Even with these restrictions, NSP-Minnesota could have paid more
than $946 million and $905 million in additional cash dividends on common stock at Dec. 31, 2007 and 2006,
respectively.
The issuance of securities by Xcel Energy generally is not subject to regulatory approval. However, utility financings and
certain intra-system financings are subject to the jurisdiction of the applicable state regulatory commissions and/or the
FERC under the Federal Power Act.
• PSCo currently has authorization to issue up to $850 million of long-term debt and up to $800 million of
short-term debt at any one time outstanding.
• SPS currently has authorization to issue up to $400 million in short-term debt.
• NSP-Wisconsin currently has authorization to issue up to $125 million of long-term debt and $75 million of
short-term debt.
• NSP-Minnesota has authorization to issue long-term securities provided the equity ratio remain between
45.99 percent and 56.21 percent and to issue short-term debt provided it does not exceed 15 percent of total
capitalization. Total capitalization for NSP-Minnesota cannot exceed $6.7 billion.
92