Xcel Energy 2007 Annual Report Download - page 61
Download and view the complete annual report
Please find page 61 of the 2007 Xcel Energy annual report below. You can navigate through the pages in the report by either clicking on the pages listed below, or by using the keyword search tool below to find specific information within the annual report.-
 1
1 -
2
-
3
-
4
-
5
-
6
-
7
-
8
-
9
-
10
-
11
-
12
-
13
-
14
-
15
-
16
-
17
-
18
-
19
-
20
-
21
-
22
-
23
-
24
-
25
-
26
-
27
-
28
-
29
-
30
-
31
-
32
-
33
-
34
-
35
-
36
-
37
-
38
-
39
-
40
-
41
-
42
-
43
-
44
-
45
-
46
-
47
-
48
-
49
-
50
-
 51
51 -
 52
52 -
 53
53 -
 54
54 -
 55
55 -
 56
56 -
 57
57 -
 58
58 -
 59
59 -
 60
60 -
 61
61 -
 62
62 -
 63
63 -
 64
64 -
 65
65 -
 66
66 -
 67
67 -
 68
68 -
 69
69 -
 70
70 -
 71
71 -
72
-
73
-
74
-
75
-
76
-
77
-
78
-
79
-
80
-
81
-
82
-
83
-
84
-
85
-
86
-
87
-
88
-
89
-
90
-
91
-
92
-
93
-
94
-
95
-
96
-
97
-
98
-
99
-
100
-
101
-
102
-
103
-
104
-
105
-
106
-
107
-
108
-
109
-
110
-
111
-
112
-
113
-
114
-
115
-
116
-
117
-
118
-
119
-
120
-
121
-
122
-
123
-
124
-
125
-
126
-
127
-
128
-
129
-
130
-
131
-
132
-
133
-
134
-
135
-
136
-
137
-
138
-
139
-
140
-
141
-
142
-
143
-
144
-
145
-
146
-
147
-
148
-
149
-
150
-
151
-
152
-
153
-
154
-
155
-
156
 |
 |

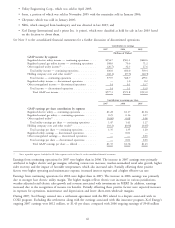
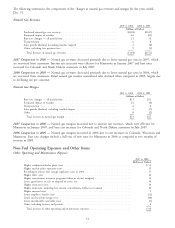
The following summarizes the components of the changes in natural gas revenues and margin for the years ended
Dec. 31:
Natural Gas Revenues
2007 vs. 2006 2006 vs. 2005
(Millions of Dollars)
Purchased natural gas cost recovery ................................. $(128) $(147)
Estimated impact of weather ..................................... 46 (33)
Base rate changes — all jurisdictions ................................ 21 32
Transportation ............................................. 6 8
Sales growth (decline) (excluding weather impact) ........................ 2 (8)
Other, including late payment fees ................................. 9 (3)
Total decrease in natural gas revenues .............................. $ (44) $(151)
2007 Comparison to 2006 — Natural gas revenues decreased primarily due to lower natural gas costs in 2007, which
are recovered from customers. Interim rate increases were effective for Minnesota in January 2007 and base rates
increased for Colorado and North Dakota customers in July 2007.
2006 Comparison to 2005 — Natural gas revenues decreased primarily due to lower natural gas costs in 2006, which
are recovered from customers. Retail natural gas weather-normalized sales declined when compared to 2005, largely due
to declining use per customer.
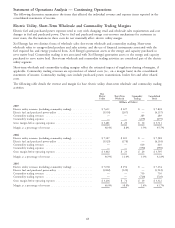
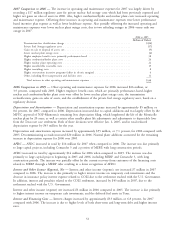
Natural Gas Margin
2007 vs. 2006 2006 vs. 2005
(Millions of Dollars)
Base rate changes — all jurisdictions ................................ $21 $32
Estimated impact of weather ..................................... 16 (4)
Transportation ............................................. 6 8
Sales growth (decline), excluding weather impact ........................ 2 (7)
Other ................................................... 8 (2)
Total increase in natural gas margin ............................... $53 $27
2007 Comparison to 2006 — Natural gas margins increased due to interim rate increases, which were effective for
Minnesota in January 2007, and base rate increases for Colorado and North Dakota customers in July 2007.
2006 Comparison to 2005 — Natural gas margins increased in 2006 due to rate increases in Colorado, Wisconsin and
Minnesota. Base rate changes include a full year of new rates for Minnesota in 2006 as compared to two months of
increase in 2005.
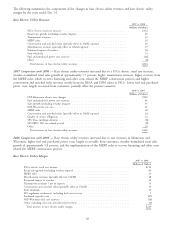
Non-Fuel Operating Expenses and Other Items
Other Operating and Maintenance Expenses
2007 vs. 2006
(Millions of Dollars)
Higher combustion/hydro plant costs ....................................... $33
Higher nuclear plant operation costs ........................................ 19
Recording of private fuel storage regulatory asset in 2006 ........................... 17
Higher labor costs ................................................... 16
Higher conservation incentive programs (offset in electric margins) ..................... 13
Lower gains/losses on sale or disposal of assets, net ............................... 10
Higher contractor costs ................................................ 10
Higher donations, including low income contributions (offset in revenues) ................ 10
Higher material costs ................................................. 5
Lower employee benefit costs ............................................ (32)
Lower nuclear plant outage costs .......................................... (10)
Lower uncollectible receivable costs ......................................... (1)
Other, including licenses and permits ....................................... 6
Total increase in other operating and maintenance expenses ........................ $96
51