Xcel Energy 2007 Annual Report Download - page 51
Download and view the complete annual report
Please find page 51 of the 2007 Xcel Energy annual report below. You can navigate through the pages in the report by either clicking on the pages listed below, or by using the keyword search tool below to find specific information within the annual report.-
 1
1 -
2
-
3
-
4
-
5
-
6
-
7
-
8
-
9
-
10
-
11
-
12
-
13
-
14
-
15
-
16
-
17
-
18
-
19
-
20
-
21
-
22
-
23
-
24
-
25
-
26
-
27
-
28
-
29
-
30
-
31
-
32
-
33
-
34
-
35
-
36
-
37
-
38
-
39
-
40
-
 41
41 -
 42
42 -
 43
43 -
 44
44 -
 45
45 -
 46
46 -
 47
47 -
 48
48 -
 49
49 -
 50
50 -
 51
51 -
 52
52 -
 53
53 -
 54
54 -
 55
55 -
 56
56 -
 57
57 -
 58
58 -
 59
59 -
 60
60 -
 61
61 -
62
-
63
-
64
-
65
-
66
-
67
-
68
-
69
-
70
-
71
-
72
-
73
-
74
-
75
-
76
-
77
-
78
-
79
-
80
-
81
-
82
-
83
-
84
-
85
-
86
-
87
-
88
-
89
-
90
-
91
-
92
-
93
-
94
-
95
-
96
-
97
-
98
-
99
-
100
-
101
-
102
-
103
-
104
-
105
-
106
-
107
-
108
-
109
-
110
-
111
-
112
-
113
-
114
-
115
-
116
-
117
-
118
-
119
-
120
-
121
-
122
-
123
-
124
-
125
-
126
-
127
-
128
-
129
-
130
-
131
-
132
-
133
-
134
-
135
-
136
-
137
-
138
-
139
-
140
-
141
-
142
-
143
-
144
-
145
-
146
-
147
-
148
-
149
-
150
-
151
-
152
-
153
-
154
-
155
-
156
 |
 |

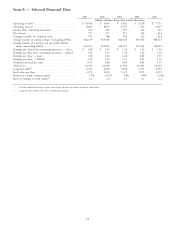
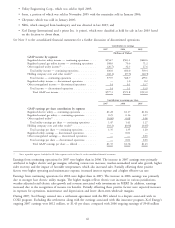
Item 6 — Selected Financial Data
2007 2006 2005 2004 2003
(Millions of Dollars, Except Share and Per-Share Data)
Operating revenues ........................ $10,034 $ 9,840 $ 9,625 $ 8,216 $ 7,731
Operating expenses ........................ 8,683 8,663 8,533 7,140 6,607
Income from continuing operations .............. 576 569 499 522 523
Net income ............................. 577 572 513 356 622
Earnings available for common stock ............. 573 568 509 352 618
Average number of common shares outstanding (000’s) . . 416,139 405,689 402,330 399,456 398,765
Average number of common and potentially dilutive
shares outstanding (000’s) ................... 433,131 429,605 425,671 423,334 418,912
Earnings per share from continuing operations — basic . . $ 1.38 $ 1.39 $ 1.23 $ 1.30 $ 1.30
Earnings per share from continuing operations — diluted . 1.35 1.35 1.20 1.26 1.26
Earnings per share — basic ................... 1.38 1.40 1.26 0.88 1.55
Earnings per share — diluted .................. 1.35 1.36 1.23 0.87 1.50
Dividends declared per share .................. 0.91 0.88 0.85 0.81 0.75
Total assets ............................. 23,185 21,958 21,505 20,305 20,205
Long-term debt(b) ......................... 6,342 6,450 5,898 6,493 6,494
Book value per share ....................... 14.70 14.28 13.37 12.99 12.95
Return on average common equity ............... 9.5% 10.1% 9.6% 6.8% 12.6%
Ratio of earnings to fixed charges(a) .............. 2.2 2.2 2.1 2.2 2.2
(a) Excludes undistributed equity income and includes allowance for funds used during construction.
(b) Long-term debt includes only debt of continuing operations.
41