Xcel Energy 2007 Annual Report Download - page 82
Download and view the complete annual report
Please find page 82 of the 2007 Xcel Energy annual report below. You can navigate through the pages in the report by either clicking on the pages listed below, or by using the keyword search tool below to find specific information within the annual report.-
 1
1 -
2
-
3
-
4
-
5
-
6
-
7
-
8
-
9
-
10
-
11
-
12
-
13
-
14
-
15
-
16
-
17
-
18
-
19
-
20
-
21
-
22
-
23
-
24
-
25
-
26
-
27
-
28
-
29
-
30
-
31
-
32
-
33
-
34
-
35
-
36
-
37
-
38
-
39
-
40
-
41
-
42
-
43
-
44
-
45
-
46
-
47
-
48
-
49
-
50
-
51
-
52
-
53
-
54
-
55
-
56
-
57
-
58
-
59
-
60
-
61
-
62
-
63
-
64
-
65
-
66
-
67
-
68
-
69
-
70
-
71
-
 72
72 -
 73
73 -
 74
74 -
 75
75 -
 76
76 -
 77
77 -
 78
78 -
 79
79 -
 80
80 -
 81
81 -
 82
82 -
 83
83 -
 84
84 -
 85
85 -
 86
86 -
 87
87 -
 88
88 -
 89
89 -
 90
90 -
 91
91 -
 92
92 -
93
-
94
-
95
-
96
-
97
-
98
-
99
-
100
-
101
-
102
-
103
-
104
-
105
-
106
-
107
-
108
-
109
-
110
-
111
-
112
-
113
-
114
-
115
-
116
-
117
-
118
-
119
-
120
-
121
-
122
-
123
-
124
-
125
-
126
-
127
-
128
-
129
-
130
-
131
-
132
-
133
-
134
-
135
-
136
-
137
-
138
-
139
-
140
-
141
-
142
-
143
-
144
-
145
-
146
-
147
-
148
-
149
-
150
-
151
-
152
-
153
-
154
-
155
-
156
 |
 |

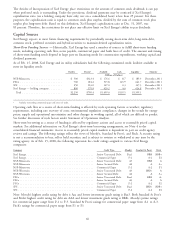
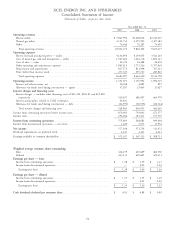
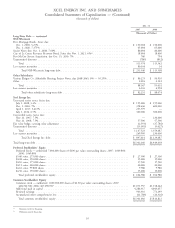
XCEL ENERGY INC. AND SUBSIDIARIES
Consolidated Statements of Income
(thousands of dollars, except per share data)
Year ended Dec. 31
2007 2006 2005
Operating revenues
Electric utility .............................................. $ 7,847,992 $7,608,018 $7,243,637
Natural gas utility ............................................ 2,111,732 2,155,999 2,307,385
Other ................................................... 74,446 76,287 74,455
Total operating revenues ...................................... 10,034,170 9,840,304 9,625,477
Operating expenses
Electric fuel and purchased power — utility ............................ 4,136,994 4,103,055 3,922,163
Cost of natural gas sold and transported — utility ........................ 1,547,622 1,644,716 1,823,123
Cost of sales — other ......................................... 24,370 24,388 24,676
Other operating and maintenance expenses ............................ 1,869,215 1,773,526 1,707,665
Depreciation and amortization .................................... 827,173 821,898 767,321
Taxes (other than income taxes) ................................... 277,723 295,727 287,810
Total operating expenses ...................................... 8,683,097 8,663,310 8,532,758
Operating income ............................................. 1,351,073 1,176,994 1,092,719
Interest and other income, net .................................... 10,948 4,085 857
Allowance for funds used during construction — equity .................... 37,207 25,045 21,627
Interest charges and financing costs
Interest charges — includes other financing costs of $21,410, $24,187 and $25,829,
respectively ............................................... 520,037 486,967 463,370
Interest and penalties related to COLI settlement ......................... 43,401 — —
Allowance for funds used during construction — debt ..................... (34,593) (30,935) (20,744)
Total interest charges and financing costs ............................ 528,845 456,032 442,626
Income from continuing operations before income taxes ...................... 870,383 750,092 672,577
Income taxes ................................................. 294,484 181,411 173,539
Income from continuing operations ................................. 575,899 568,681 499,038
Income from discontinued operations — net of tax ......................... 1,449 3,073 13,934
Net income ................................................. 577,348 571,754 512,972
Dividend requirements on preferred stock ............................... 4,241 4,241 4,241
Earnings available to common shareholders .............................. $ 573,107 $ 567,513 $ 508,731
Weighted average common shares outstanding
Basic .................................................... 416,139 405,689 402,330
Diluted .................................................. 433,131 429,605 425,671
Earnings per share — basic
Income from continuing operations ................................. $ 1.38 $ 1.39 $ 1.23
Income from discontinued operations ................................ — 0.01 0.03
Earnings per share .......................................... $ 1.38 $ 1.40 $ 1.26
Earnings per share — diluted
Income from continuing operations ................................. $ 1.35 $ 1.35 $ 1.20
Income from discontinued operations ................................ — 0.01 0.03
Earnings per share .......................................... $ 1.35 $ 1.36 $ 1.23
Cash dividends declared per common share ............................ $ 0.91 $ 0.88 $ 0.85
72