Xcel Energy 2007 Annual Report Download - page 132
Download and view the complete annual report
Please find page 132 of the 2007 Xcel Energy annual report below. You can navigate through the pages in the report by either clicking on the pages listed below, or by using the keyword search tool below to find specific information within the annual report.-
 1
1 -
2
-
3
-
4
-
5
-
6
-
7
-
8
-
9
-
10
-
11
-
12
-
13
-
14
-
15
-
16
-
17
-
18
-
19
-
20
-
21
-
22
-
23
-
24
-
25
-
26
-
27
-
28
-
29
-
30
-
31
-
32
-
33
-
34
-
35
-
36
-
37
-
38
-
39
-
40
-
41
-
42
-
43
-
44
-
45
-
46
-
47
-
48
-
49
-
50
-
51
-
52
-
53
-
54
-
55
-
56
-
57
-
58
-
59
-
60
-
61
-
62
-
63
-
64
-
65
-
66
-
67
-
68
-
69
-
70
-
71
-
72
-
73
-
74
-
75
-
76
-
77
-
78
-
79
-
80
-
81
-
82
-
83
-
84
-
85
-
86
-
87
-
88
-
89
-
90
-
91
-
92
-
93
-
94
-
95
-
96
-
97
-
98
-
99
-
100
-
101
-
102
-
103
-
104
-
105
-
106
-
107
-
108
-
109
-
110
-
111
-
112
-
113
-
114
-
115
-
116
-
117
-
118
-
119
-
120
-
121
-
 122
122 -
 123
123 -
 124
124 -
 125
125 -
 126
126 -
 127
127 -
 128
128 -
 129
129 -
 130
130 -
 131
131 -
 132
132 -
 133
133 -
 134
134 -
 135
135 -
 136
136 -
 137
137 -
 138
138 -
 139
139 -
 140
140 -
 141
141 -
 142
142 -
143
-
144
-
145
-
146
-
147
-
148
-
149
-
150
-
151
-
152
-
153
-
154
-
155
-
156
 |
 |

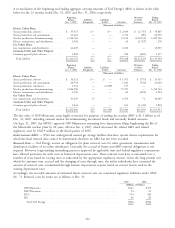
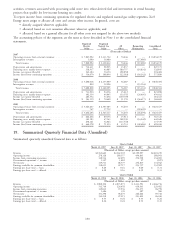
A reconciliation of the beginning and ending aggregate carrying amounts of Xcel Energy’s AROs is shown in the table
below for the 12 months ended Dec. 31, 2007 and Dec. 31, 2006, respectively:
Beginning Revisions Ending
Balance Liabilities Liabilities to Prior Balance
Jan. 1, 2007 Recognized Settled Accretion Estimates Dec. 31, 2007
(Thousands of Dollars)
Electric Utility Plant:
Steam production asbestos ............ $ 35,515 $— $— $ 2,049 $ (1,757) $ 35,807
Steam production ash containment ...... 21,416 — — 1,212 (89) 22,539
Nuclear production decommissioning ..... 1,256,763 — — 73,914 (120,931) 1,209,746
Electric transmission and distribution ..... 1,994 — — 43 (1,767) 270
Gas Utility Plant:
Gas transmission and distribution ....... 44,405 — — 1,100 — 45,505
Common Utility and Other Property:
Common general plant asbestos ........ 1,858 — — 100 (681) 1,277
Total liability .................. $1,361,951 $— $— $78,418 $(125,225) $1,315,144
Beginning Revisions Ending
Balance Liabilities Liabilities to Prior Balance
Jan. 1, 2006 Recognized Settled Accretion Estimates Dec. 31, 2006
(Thousands of Dollars)
Electric Utility Plant:
Steam production asbestos ............ $ 34,323 $— $ — $ 1,971 $ (779) $ 35,515
Steam production ash containment ...... 20,934 — — 1,183 (701) 21,416
Steam production retirement .......... 3,152 — (3,309) 157 — —
Nuclear production decommissioning ..... 1,184,968 — — 71,795 — 1,256,763
Electric transmission and distribution ..... 2,350 — — 62 (418) 1,994
Gas Utility Plant:
Gas transmission and distribution ....... 43,245 15 — 1,074 71 44,405
Common Utility and Other Property:
Common general plant asbestos ........ 3,034 — — 162 (1,338) 1,858
Total liability .................. $1,292,006 $15 $(3,309) $76,404 $(3,165) $1,361,951
The fair value of NSP-Minnesota assets legally restricted, for purposes of settling the nuclear ARO is $1.3 billion as of
Dec. 31, 2007, including external nuclear decommissioning investment funds and internally funded amounts.
On Sept. 21, 2007, the MPUC approved NSP-Minnesota’s remaining lives depreciation filing lengthening the life of
the Monticello nuclear plant by 20 years, effective Jan. 1, 2007, which decreased the related ARO and related
regulatory asset by $120.9 million in the third quarter of 2007.
Indeterminate AROs — PSCo has underground natural gas storage facilities that have special closure requirements for
which the final removal date cannot be determined, therefore an ARO has not been recorded.
Removal Costs — Xcel Energy accrues an obligation for plant removal costs for other generation, transmission and
distribution facilities of its utility subsidiaries. Generally, the accrual of future non-ARO removal obligations is not
required. However, long-standing ratemaking practices approved by applicable state and federal regulatory commissions
have allowed provisions for such costs in historical depreciation rates. These removal costs have accumulated over a
number of years based on varying rates as authorized by the appropriate regulatory entities. Given the long periods over
which the amounts were accrued and the changing of rates through time, the utility subsidiaries have estimated the
amount of removal costs accumulated through historic depreciation expense based on current factors used in the
existing depreciation rates.
Accordingly, the recorded amounts of estimated future removal costs are considered regulatory liabilities under SFAS
No. 71. Removal costs by entity are as follows at Dec. 31:
2007 2006
(Millions of Dollars)
NSP-Minnesota ............................................ $342 $355
NSP-Wisconsin ............................................ 94 91
PSCo ................................................... 374 389
SPS.................................................... 96 85
Total Xcel Energy ......................................... $906 $920
122