Western Union 2012 Annual Report Download - page 84
Download and view the complete annual report
Please find page 84 of the 2012 Western Union annual report below. You can navigate through the pages in the report by either clicking on the pages listed below, or by using the keyword search tool below to find specific information within the annual report.-
 1
1 -
2
-
3
-
4
-
5
-
6
-
7
-
8
-
9
-
10
-
11
-
12
-
13
-
14
-
15
-
16
-
17
-
18
-
19
-
20
-
21
-
22
-
23
-
24
-
25
-
26
-
27
-
28
-
29
-
30
-
31
-
32
-
33
-
34
-
35
-
36
-
37
-
38
-
39
-
40
-
41
-
42
-
43
-
44
-
45
-
46
-
47
-
48
-
49
-
50
-
51
-
52
-
53
-
54
-
55
-
56
-
57
-
58
-
59
-
60
-
61
-
62
-
63
-
64
-
65
-
66
-
67
-
68
-
69
-
70
-
71
-
72
-
73
-
 74
74 -
 75
75 -
 76
76 -
 77
77 -
 78
78 -
 79
79 -
 80
80 -
 81
81 -
 82
82 -
 83
83 -
 84
84 -
 85
85 -
 86
86 -
 87
87 -
 88
88 -
 89
89 -
 90
90 -
 91
91 -
 92
92 -
 93
93 -
 94
94 -
95
-
96
-
97
-
98
-
99
-
100
-
101
-
102
-
103
-
104
-
105
-
106
-
107
-
108
-
109
-
110
-
111
-
112
-
113
-
114
-
115
-
116
-
117
-
118
-
119
-
120
-
121
-
122
-
123
-
124
-
125
-
126
-
127
-
128
-
129
-
130
-
131
-
132
-
133
-
134
-
135
-
136
-
137
-
138
-
139
-
140
-
141
-
142
-
143
-
144
-
145
-
146
-
147
-
148
-
149
-
150
-
151
-
152
-
153
-
154
-
155
-
156
-
157
-
158
 |
 |
79
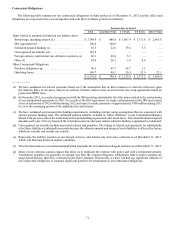
As of December 31, 2012, we had $300.0 million of floating notes, which had an effective interest rate of 0.9% or 58 basis
points above three-month LIBOR. Additionally, $800.0 million of our fixed-rate borrowings at par value are effectively floating
rate debt through interest rate swap agreements, changing this fixed-rate debt to LIBOR-based floating rate debt, with weighted-
average spreads of approximately 500 basis points above LIBOR. Borrowings under our commercial paper program mature in
such a short period that the financing is effectively floating rate. There were no commercial paper borrowings outstanding as of
December 31, 2012.
We review our overall exposure to floating and fixed rates by evaluating our net asset or liability position in each, also
considering the duration of the individual positions. We manage this mix of fixed versus floating exposure in an attempt to minimize
risk, reduce costs and improve returns. Our exposure to interest rates can be modified by changing the mix of our interest-bearing
assets as well as adjusting the mix of fixed versus floating rate debt. The latter is accomplished primarily through the use of interest
rate swaps and the decision regarding terms of any new debt issuances (i.e., fixed versus floating). We use interest rate swaps
designated as hedges to increase the percentage of floating rate debt, subject to market conditions. As of December 31, 2012, our
weighted-average effective rate was approximately 4.8%.
A hypothetical 100 basis point increase/decrease in interest rates would result in a decrease/increase to pre-tax income of
approximately $11 million annually based on borrowings on December 31, 2012 and 2011, respectively, that are sensitive to
interest rate fluctuations. The same 100 basis point increase/decrease in interest rates, if applied to our cash and investment balances
on December 31, 2012 and 2011 that are sensitive to interest rate fluctuations, would result in an offsetting benefit/reduction to
pre-tax income of approximately $21 million and $18 million annually, respectively. There are inherent limitations in the sensitivity
analysis presented, primarily due to the assumption that interest rate changes would be instantaneous. As a result, the analysis is
unable to reflect the potential effects of more complex market changes, including changes in credit risk regarding our investments,
which may positively or negatively affect income. In addition, the current mix of fixed versus floating rate debt and investments
and the level of assets and liabilities will change over time. We will also be further impacted by changes to future interest rates as
we refinance our debt or by reinvesting proceeds from the sale or maturity of our investments.
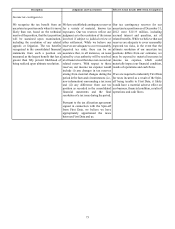
Credit Risk
Our interest earning assets include investment securities, substantially all of which are highly-rated state and municipal debt
securities, which are classified in “Settlement assets” and accounted for as available-for-sale securities, and money market fund
investments, which are classified in “Cash and cash equivalents.” As of December 31, 2012, the majority of our investment
securities had credit ratings of “AA-” or better from a major credit rating agency.
To manage our exposures to credit risk with respect to investment securities, money market fund investments, derivatives
and other credit risk exposures resulting from our relationships with banks and financial institutions, we regularly review investment
concentrations, trading levels, credit spreads and credit ratings, and we attempt to diversify our investments among global financial
institutions. We also limit our investment level in any individual money market fund to no more than $100 million.
We are also exposed to credit risk related to receivable balances from agents in the money transfer, walk-in bill payment and
money order settlement process. In addition, we are exposed to credit risk directly from consumer transactions particularly through
our Internet services and electronic channels, where transactions are originated through means other than cash, and therefore are
subject to “chargebacks,” insufficient funds or other collection impediments, such as fraud. We perform a credit review before
each agent signing and conduct periodic analyses.
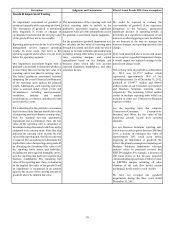
We are exposed to credit risk in our Business Solutions business relating to: (a) derivatives written by us to our customers
and (b) receivables from certain customers for which beneficiaries are paid prior to receiving cleared funds from the customer,
where we have offered “trade credit.” For the derivatives, the duration of these contracts at inception is generally less than one
year. The credit risk associated with our derivative contracts increases when foreign currency exchange rates move against our
customers, possibly impacting their ability to honor their obligations to deliver currency to us or to maintain appropriate collateral
with us. For those receivables where we have offered trade credit, collection ordinarily occurs within a few days. To mitigate risk,
we perform credit reviews of the customer on an ongoing basis, and, for our derivatives, we may require certain customers to post
collateral or increase collateral based on the fair value of the customer's contract and their risk profile.
Our losses associated with bad debts have been less than 1% of our revenues in all periods presented.