Western Union 2012 Annual Report Download - page 136
Download and view the complete annual report
Please find page 136 of the 2012 Western Union annual report below. You can navigate through the pages in the report by either clicking on the pages listed below, or by using the keyword search tool below to find specific information within the annual report.-
 1
1 -
2
-
3
-
4
-
5
-
6
-
7
-
8
-
9
-
10
-
11
-
12
-
13
-
14
-
15
-
16
-
17
-
18
-
19
-
20
-
21
-
22
-
23
-
24
-
25
-
26
-
27
-
28
-
29
-
30
-
31
-
32
-
33
-
34
-
35
-
36
-
37
-
38
-
39
-
40
-
41
-
42
-
43
-
44
-
45
-
46
-
47
-
48
-
49
-
50
-
51
-
52
-
53
-
54
-
55
-
56
-
57
-
58
-
59
-
60
-
61
-
62
-
63
-
64
-
65
-
66
-
67
-
68
-
69
-
70
-
71
-
72
-
73
-
74
-
75
-
76
-
77
-
78
-
79
-
80
-
81
-
82
-
83
-
84
-
85
-
86
-
87
-
88
-
89
-
90
-
91
-
92
-
93
-
94
-
95
-
96
-
97
-
98
-
99
-
100
-
101
-
102
-
103
-
104
-
105
-
106
-
107
-
108
-
109
-
110
-
111
-
112
-
113
-
114
-
115
-
116
-
117
-
118
-
119
-
120
-
121
-
122
-
123
-
124
-
125
-
 126
126 -
 127
127 -
 128
128 -
 129
129 -
 130
130 -
 131
131 -
 132
132 -
 133
133 -
 134
134 -
 135
135 -
 136
136 -
 137
137 -
 138
138 -
 139
139 -
 140
140 -
 141
141 -
 142
142 -
 143
143 -
 144
144 -
 145
145 -
 146
146 -
147
-
148
-
149
-
150
-
151
-
152
-
153
-
154
-
155
-
156
-
157
-
158
 |
 |
THE WESTERN UNION COMPANY
NOTES TO CONSOLIDATED FINANCIAL STATEMENTS (Continued)
131
Expected dividend yield - The Company's expected annual dividend yield is the calculation of the annualized Western Union
dividend divided by an average Western Union stock price on each respective grant date.
Expected volatility - For the Company's executives and non-employee directors, the expected volatility for the 2012, 2011
and 2010 grants was 33.2%, 29.7% and 32.8%, respectively. The expected volatility for the Company's non-executive employees
was 33.2%, 31.9% and 34.5% for the 2012, 2011 and 2010 grants, respectively. The Company used a blend of implied and historical
volatility. The Company's implied volatility was calculated using the market price of traded options on Western Union's common
stock and the historical volatility of Western Union stock data. Prior to 2012, the Company's historical volatility represented a
blend of Western Union and First Data (prior to the Spin-off) stock data.
Expected term - For 2012, Western Union's expected term for all employees was approximately 6 years. For 2011 and 2010,
Western Union's expected term was approximately 5 years for non-executive employees and approximately 7 years for executives
and non-employee directors. The Company's expected term of options was based upon, among other things, historical exercises,
the vesting term of the Company's options and the options' contractual term of ten years.
The assumptions used to calculate the fair value of options granted will be evaluated and revised, as necessary, to reflect
market conditions and the Company's historical experience and future expectations. The calculated fair value is recognized as
compensation cost in the Company's consolidated financial statements over the requisite service period of the entire award.
Compensation cost is recognized only for those options expected to vest, with forfeitures estimated at the date of grant and evaluated
and adjusted periodically to reflect the Company's historical experience and future expectations. Any change in the forfeiture
assumption will be accounted for as a change in estimate, with the cumulative effect of the change on periods previously reported
being reflected in the consolidated financial statements of the period in which the change is made. In the future, as more historical
data is available to calculate the volatility of Western Union stock and the actual terms Western Union employees hold options,
expected volatility and expected term may change which could change the grant-date fair value of future stock option awards and,
ultimately, the recorded compensation expense.
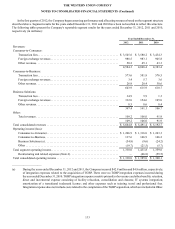
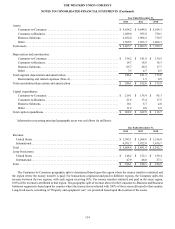
17. Segments
As previously described in Note 1, the Company classifies its businesses into three segments: Consumer-to-Consumer,
Consumer-to-Business and Business Solutions. Operating segments are defined as components of an enterprise that engage in
business activities, about which separate financial information is available that is evaluated regularly by the Company's CODM
in deciding where to allocate resources and in assessing performance.
The Consumer-to-Consumer operating segment facilitates money transfers between two consumers. The Company's money
transfer service is viewed by the Company as one interconnected global network where a money transfer can be sent from one
location to another, around the world, including related transactions that can be initiated through the Company's websites and
account based money transfers. The segment includes six regions whose functions are limited to generating, managing and
maintaining agent relationships and localized marketing activities. These regions interact on transactions with consumers and
share common processes, systems and licenses, thereby constituting one global Consumer-to-Consumer money transfer business
and one operating segment.
The Consumer-to-Business operating segment facilitates bill payments from consumers to businesses and other organizations,
including utilities, auto finance companies, mortgage servicers, financial service providers, government agencies and other
businesses.
The Business Solutions operating segment facilitates payment and foreign exchange solutions, primarily cross-border, cross-
currency transactions, for small and medium size enterprises and other organizations and individuals.
All businesses that have not been classified in the above segments are reported as “Other” and include the Company's money
order, prepaid services, mobile money transfer, and other businesses and services.