Western Union 2012 Annual Report Download - page 67
Download and view the complete annual report
Please find page 67 of the 2012 Western Union annual report below. You can navigate through the pages in the report by either clicking on the pages listed below, or by using the keyword search tool below to find specific information within the annual report.-
 1
1 -
2
-
3
-
4
-
5
-
6
-
7
-
8
-
9
-
10
-
11
-
12
-
13
-
14
-
15
-
16
-
17
-
18
-
19
-
20
-
21
-
22
-
23
-
24
-
25
-
26
-
27
-
28
-
29
-
30
-
31
-
32
-
33
-
34
-
35
-
36
-
37
-
38
-
39
-
40
-
41
-
42
-
43
-
44
-
45
-
46
-
47
-
48
-
49
-
50
-
51
-
52
-
53
-
54
-
55
-
56
-
 57
57 -
 58
58 -
 59
59 -
 60
60 -
 61
61 -
 62
62 -
 63
63 -
 64
64 -
 65
65 -
 66
66 -
 67
67 -
 68
68 -
 69
69 -
 70
70 -
 71
71 -
 72
72 -
 73
73 -
 74
74 -
 75
75 -
 76
76 -
 77
77 -
78
-
79
-
80
-
81
-
82
-
83
-
84
-
85
-
86
-
87
-
88
-
89
-
90
-
91
-
92
-
93
-
94
-
95
-
96
-
97
-
98
-
99
-
100
-
101
-
102
-
103
-
104
-
105
-
106
-
107
-
108
-
109
-
110
-
111
-
112
-
113
-
114
-
115
-
116
-
117
-
118
-
119
-
120
-
121
-
122
-
123
-
124
-
125
-
126
-
127
-
128
-
129
-
130
-
131
-
132
-
133
-
134
-
135
-
136
-
137
-
138
-
139
-
140
-
141
-
142
-
143
-
144
-
145
-
146
-
147
-
148
-
149
-
150
-
151
-
152
-
153
-
154
-
155
-
156
-
157
-
158
 |
 |

62
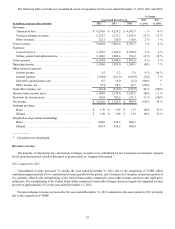
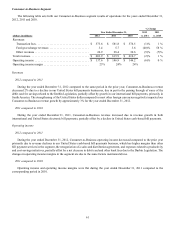
Business Solutions
The following table sets forth our Business Solutions segment results of operations for the years ended December 31, 2012,
2011 and 2010.
% Change
Year Ended December 31, 2012 2011
(dollars in millions) 2012 2011 2010 vs. 2011 vs. 2010
Revenues:
Transaction fees . . . . . . . . . . . . . . . . . . . . . . . . . . . . . . . . . . . . $ 34.9 $ 5.9 $ 1.3 * *
Foreign exchange revenues . . . . . . . . . . . . . . . . . . . . . . . . . . . 332.0 154.6 105.0 * *
Other revenues . . . . . . . . . . . . . . . . . . . . . . . . . . . . . . . . . . . . . 0.5 0.6 0.4 * *
Total revenues . . . . . . . . . . . . . . . . . . . . . . . . . . . . . . . . . . . . . . . . $ 367.4 $ 161.1 $ 106.7 * *
Operating loss . . . . . . . . . . . . . . . . . . . . . . . . . . . . . . . . . . . . . . . . $ (54.8) $ (9.6) $ (24.2) * *
Operating loss margin . . . . . . . . . . . . . . . . . . . . . . . . . . . . . . . . . . (15)% (6)% (23)%
____________
* Calculation not meaningful
Revenues
2012 compared to 2011
During the year ended December 31, 2012, Business Solutions revenue grew compared to the prior year primarily due to our
acquisition of TGBP, which contributed a substantial majority of our revenue growth for the year ended December 31, 2012.
2011 compared to 2010
During the year ended December 31, 2011, Business Solutions revenue grew compared to the prior year due to our acquisition
of TGBP, which contributed $35.2 million of revenue, and revenue growth in our existing business.
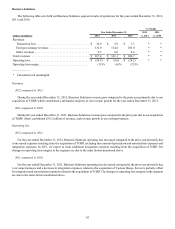
Operating loss
2012 compared to 2011
For the year ended December 31, 2012, Business Solutions operating loss increased compared to the prior year primarily due
to increased expenses resulting from the acquisition of TGBP, including incremental depreciation and amortization expenses and
integration expenses. In 2013, we expect to incur additional integration expenses resulting from the acquisition of TGBP. The
changes in operating loss margins in the segment are due to the same factors mentioned above.
2011 compared to 2010
For the year ended December 31, 2011, Business Solutions operating loss decreased compared to the prior year primarily due
to revenue increases and a decrease in integration expenses related to the acquisition of Custom House, but were partially offset
by integration and amortization expenses related to the acquisition of TGBP. The changes in operating loss margins in the segment
are due to the same factors mentioned above.