Western Union 2012 Annual Report Download - page 122
Download and view the complete annual report
Please find page 122 of the 2012 Western Union annual report below. You can navigate through the pages in the report by either clicking on the pages listed below, or by using the keyword search tool below to find specific information within the annual report.-
 1
1 -
2
-
3
-
4
-
5
-
6
-
7
-
8
-
9
-
10
-
11
-
12
-
13
-
14
-
15
-
16
-
17
-
18
-
19
-
20
-
21
-
22
-
23
-
24
-
25
-
26
-
27
-
28
-
29
-
30
-
31
-
32
-
33
-
34
-
35
-
36
-
37
-
38
-
39
-
40
-
41
-
42
-
43
-
44
-
45
-
46
-
47
-
48
-
49
-
50
-
51
-
52
-
53
-
54
-
55
-
56
-
57
-
58
-
59
-
60
-
61
-
62
-
63
-
64
-
65
-
66
-
67
-
68
-
69
-
70
-
71
-
72
-
73
-
74
-
75
-
76
-
77
-
78
-
79
-
80
-
81
-
82
-
83
-
84
-
85
-
86
-
87
-
88
-
89
-
90
-
91
-
92
-
93
-
94
-
95
-
96
-
97
-
98
-
99
-
100
-
101
-
102
-
103
-
104
-
105
-
106
-
107
-
108
-
109
-
110
-
111
-
 112
112 -
 113
113 -
 114
114 -
 115
115 -
 116
116 -
 117
117 -
 118
118 -
 119
119 -
 120
120 -
 121
121 -
 122
122 -
 123
123 -
 124
124 -
 125
125 -
 126
126 -
 127
127 -
 128
128 -
 129
129 -
 130
130 -
 131
131 -
 132
132 -
133
-
134
-
135
-
136
-
137
-
138
-
139
-
140
-
141
-
142
-
143
-
144
-
145
-
146
-
147
-
148
-
149
-
150
-
151
-
152
-
153
-
154
-
155
-
156
-
157
-
158
 |
 |

THE WESTERN UNION COMPANY
NOTES TO CONSOLIDATED FINANCIAL STATEMENTS (Continued)
117
(a) Funds included herein have redemption frequencies of daily to monthly, with redemption notice periods of one to ten
business days.
(b) Substantially all corporate debt securities are investment grade securities.
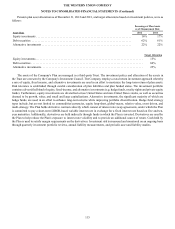
(c) Hedge funds generally hold liquid and readily priceable securities, such as public equities, exchange-traded derivatives, and
corporate bonds. Hedge funds themselves do not have readily available market quotations, and therefore are valued using
the Net Asset Value (“NAV”) per share provided by the investment sponsor or third party administrator. Funds investing in
diverse hedge fund strategies (primarily commingled funds) with the following composition of underlying hedge fund
investments within the pension plans at December 31, 2012: commodities/currencies (24%), equity long/short (21%),
global-macro (16%), relative value (16%), event driven (13%), and multi-strategy (10%). As of December 31, 2012, funds
included herein had redemption frequencies of monthly to quarterly, with redemption notice periods of one to 45 days.
(d) Diversified investments in royalty rights related to the sale of pharmaceutical products by third parties. Also included are
private equity funds with a focus on venture capital. These investments are illiquid, with investment distributions expected
to be received over the next five to seven years.
The maturities of debt securities as of December 31, 2012 range from less than one year to approximately 32 years with a
weighted-average maturity of 15 years.
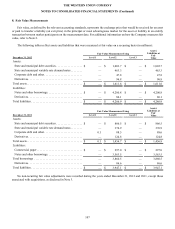
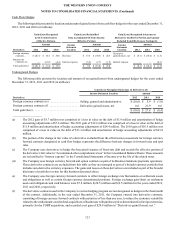
The following tables provide summaries of changes in the fair value of the Trust's Level 3 financial assets (in millions):
Royalty
Rights
Private
Equity Total
Balance, January 1, 2011. . . . . . . . . . . . . . . . . . . . . . . . . . . . . . . . . . . . . . . . . . . . . . . $ — $ 1.3 $ 1.3
Actual return on plan assets:
Relating to assets still held as of the reporting date . . . . . . . . . . . . . . . . . . . . . . . . — (0.8)(0.8)
Relating to assets sold during the period . . . . . . . . . . . . . . . . . . . . . . . . . . . . . . . . — 0.9 0.9
Net purchases and sales . . . . . . . . . . . . . . . . . . . . . . . . . . . . . . . . . . . . . . . . . . . . . . . . 11.4 0.8 12.2
Balance, December 31, 2011. . . . . . . . . . . . . . . . . . . . . . . . . . . . . . . . . . . . . . . . . . . . $ 11.4 $ 2.2 $ 13.6
Actual return on plan assets:
Relating to assets still held as of the reporting date . . . . . . . . . . . . . . . . . . . . . . . . 1.6 0.1 1.7
Relating to assets sold during the period . . . . . . . . . . . . . . . . . . . . . . . . . . . . . . . . 0.8 (0.1) 0.7
Net purchases and sales . . . . . . . . . . . . . . . . . . . . . . . . . . . . . . . . . . . . . . . . . . . . . . . . 7.6 0.2 7.8
Balance, December 31, 2012. . . . . . . . . . . . . . . . . . . . . . . . . . . . . . . . . . . . . . . . . . . . $ 21.4 $ 2.4 $ 23.8
Royalty rights are held through investment funds. These investments are priority interests in contractual royalty revenue
derived from the sale of pharmaceutical products that entitle the investment fund to receive a portion of revenue from the patent-
protected product. The fair value of the Company's investment in royalty rights is estimated using consensus sales estimates for
the pharmaceutical products obtained from third-party experts, which are multiplied by the contractual royalty rate, and then
discounted by an interest rate based off the estimated weighted average cost of capital of the pharmaceutical sector (approximately
12%).
Private equity funds invest in the non-marketable securities of individual private companies. These private companies
ultimately may become public in the future. The fair value of the Company's investment in private equity funds is estimated using
many types of inputs, including historical sales multiples, valuations of comparable public companies, and recently completed
equity financings.