Western Union 2012 Annual Report Download - page 112
Download and view the complete annual report
Please find page 112 of the 2012 Western Union annual report below. You can navigate through the pages in the report by either clicking on the pages listed below, or by using the keyword search tool below to find specific information within the annual report.-
 1
1 -
2
-
3
-
4
-
5
-
6
-
7
-
8
-
9
-
10
-
11
-
12
-
13
-
14
-
15
-
16
-
17
-
18
-
19
-
20
-
21
-
22
-
23
-
24
-
25
-
26
-
27
-
28
-
29
-
30
-
31
-
32
-
33
-
34
-
35
-
36
-
37
-
38
-
39
-
40
-
41
-
42
-
43
-
44
-
45
-
46
-
47
-
48
-
49
-
50
-
51
-
52
-
53
-
54
-
55
-
56
-
57
-
58
-
59
-
60
-
61
-
62
-
63
-
64
-
65
-
66
-
67
-
68
-
69
-
70
-
71
-
72
-
73
-
74
-
75
-
76
-
77
-
78
-
79
-
80
-
81
-
82
-
83
-
84
-
85
-
86
-
87
-
88
-
89
-
90
-
91
-
92
-
93
-
94
-
95
-
96
-
97
-
98
-
99
-
100
-
101
-
 102
102 -
 103
103 -
 104
104 -
 105
105 -
 106
106 -
 107
107 -
 108
108 -
 109
109 -
 110
110 -
 111
111 -
 112
112 -
 113
113 -
 114
114 -
 115
115 -
 116
116 -
 117
117 -
 118
118 -
 119
119 -
 120
120 -
 121
121 -
 122
122 -
123
-
124
-
125
-
126
-
127
-
128
-
129
-
130
-
131
-
132
-
133
-
134
-
135
-
136
-
137
-
138
-
139
-
140
-
141
-
142
-
143
-
144
-
145
-
146
-
147
-
148
-
149
-
150
-
151
-
152
-
153
-
154
-
155
-
156
-
157
-
158
 |
 |

THE WESTERN UNION COMPANY
NOTES TO CONSOLIDATED FINANCIAL STATEMENTS (Continued)
107
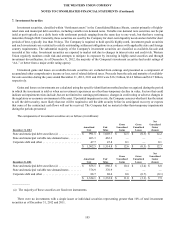
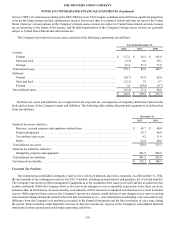
8. Fair Value Measurements
Fair value, as defined by the relevant accounting standards, represents the exchange price that would be received for an asset
or paid to transfer a liability (an exit price) in the principal or most advantageous market for the asset or liability in an orderly
transaction between market participants on the measurement date. For additional information on how the Company measures fair
value, refer to Note 2.
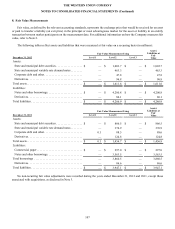
The following tables reflect assets and liabilities that were measured at fair value on a recurring basis (in millions):
Fair Value Measurement Using
Assets/
Liabilities at
Fair
Val ue
December 31, 2012 Level 1 Level 2 Level 3
Assets:
State and municipal debt securities . . . . . . . . . . . . . . . . . . $ — $ 1,003.7 $ — $ 1,003.7
State and municipal variable rate demand notes . . . . . . . . — 463.3 — 463.3
Corporate debt and other . . . . . . . . . . . . . . . . . . . . . . . . . . — 47.8 — 47.8
Derivatives. . . . . . . . . . . . . . . . . . . . . . . . . . . . . . . . . . . . . — 96.8 — 96.8
Total assets. . . . . . . . . . . . . . . . . . . . . . . . . . . . . . . . . . . . . . $ — $ 1,611.6 $ — $ 1,611.6
Liabilities:
Notes and other borrowings. . . . . . . . . . . . . . . . . . . . . . . . $ — $ 4,200.8 $ — $ 4,200.8
Derivatives. . . . . . . . . . . . . . . . . . . . . . . . . . . . . . . . . . . . . — 86.1 — 86.1
Total liabilities . . . . . . . . . . . . . . . . . . . . . . . . . . . . . . . . . . . $ — $ 4,286.9 $ — $ 4,286.9
Fair Value Measurement Using
Assets/
Liabilities at
Fair
Val ue
December 31, 2011 Level 1 Level 2 Level 3
Assets:
State and municipal debt securities . . . . . . . . . . . . . . . . . . $ — $ 866.5 $ — $ 866.5
State and municipal variable rate demand notes . . . . . . . . — 376.9 — 376.9
Corporate debt and other . . . . . . . . . . . . . . . . . . . . . . . . . . 0.1 88.5 — 88.6
Derivatives. . . . . . . . . . . . . . . . . . . . . . . . . . . . . . . . . . . . . — 124.8 — 124.8
Total assets. . . . . . . . . . . . . . . . . . . . . . . . . . . . . . . . . . . . . . $ 0.1 $ 1,456.7 $ — $ 1,456.8
Liabilities:
Commercial paper . . . . . . . . . . . . . . . . . . . . . . . . . . . . . . . $ — $ 297.0 $ — $ 297.0
Notes and other borrowings. . . . . . . . . . . . . . . . . . . . . . . . — 3,563.5 — 3,563.5
Total borrowings . . . . . . . . . . . . . . . . . . . . . . . . . . . . . . . . . — 3,860.5 — 3,860.5
Derivatives. . . . . . . . . . . . . . . . . . . . . . . . . . . . . . . . . . . . . — 86.6 — 86.6
Total liabilities . . . . . . . . . . . . . . . . . . . . . . . . . . . . . . . . . . . $ — $ 3,947.1 $ — $ 3,947.1
No non-recurring fair value adjustments were recorded during the years ended December 31, 2012 and 2011, except those
associated with acquisitions, as disclosed in Note 3.