Western Union 2012 Annual Report Download - page 61
Download and view the complete annual report
Please find page 61 of the 2012 Western Union annual report below. You can navigate through the pages in the report by either clicking on the pages listed below, or by using the keyword search tool below to find specific information within the annual report.-
 1
1 -
2
-
3
-
4
-
5
-
6
-
7
-
8
-
9
-
10
-
11
-
12
-
13
-
14
-
15
-
16
-
17
-
18
-
19
-
20
-
21
-
22
-
23
-
24
-
25
-
26
-
27
-
28
-
29
-
30
-
31
-
32
-
33
-
34
-
35
-
36
-
37
-
38
-
39
-
40
-
41
-
42
-
43
-
44
-
45
-
46
-
47
-
48
-
49
-
50
-
 51
51 -
 52
52 -
 53
53 -
 54
54 -
 55
55 -
 56
56 -
 57
57 -
 58
58 -
 59
59 -
 60
60 -
 61
61 -
 62
62 -
 63
63 -
 64
64 -
 65
65 -
 66
66 -
 67
67 -
 68
68 -
 69
69 -
 70
70 -
 71
71 -
72
-
73
-
74
-
75
-
76
-
77
-
78
-
79
-
80
-
81
-
82
-
83
-
84
-
85
-
86
-
87
-
88
-
89
-
90
-
91
-
92
-
93
-
94
-
95
-
96
-
97
-
98
-
99
-
100
-
101
-
102
-
103
-
104
-
105
-
106
-
107
-
108
-
109
-
110
-
111
-
112
-
113
-
114
-
115
-
116
-
117
-
118
-
119
-
120
-
121
-
122
-
123
-
124
-
125
-
126
-
127
-
128
-
129
-
130
-
131
-
132
-
133
-
134
-
135
-
136
-
137
-
138
-
139
-
140
-
141
-
142
-
143
-
144
-
145
-
146
-
147
-
148
-
149
-
150
-
151
-
152
-
153
-
154
-
155
-
156
-
157
-
158
 |
 |
56
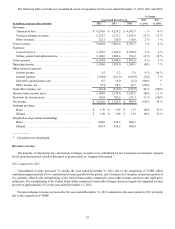
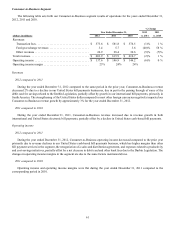
Total other expense, net
Total other expense, net increased during the year ended December 31, 2012 compared to the same period in 2011 primarily
due to the prior year gains of $20.5 million and $29.4 million in connection with the remeasurement of our former equity interests
in Finint and Costa, respectively, to fair value, associated with these acquisitions. Additionally, during the prior year we recognized
a $20.8 million net gain on foreign currency forward contracts entered into in order to reduce the economic variability related to
the cash amounts used to fund acquisitions of businesses with purchase prices denominated in foreign currencies, primarily for
the TGBP acquisition.
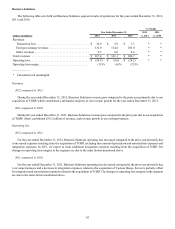
Total other expense, net decreased during the year ended December 31, 2011 compared to the same period in 2010 due to the
gains recognized in connection with the remeasurement of our former equity interests in Finint and Costa and the net gain on
foreign currency forward contracts, both of which are described above. These amounts were partially offset by increased interest
expense in 2011 due to increased borrowings outstanding.
Income taxes
Our effective tax rates on pre-tax income were 12.2%, 8.6% and 20.5% for the years ended December 31, 2012, 2011 and
2010, respectively. The significant decrease in our effective tax rate for the years ended December 31, 2012 and 2011 is primarily
due to an agreement with the United States Internal Revenue Service resolving substantially all of the issues related to the
restructuring of our international operations in 2003, and resulted in a tax benefit of $204.7 million related to the adjustment of
reserves associated with this matter for the year ended December 31, 2011. For the year ended December 31, 2012, our effective
tax rate was also impacted by benefits from favorable tax settlements and changes in the mix of foreign and U.S. income and
applicable tax rates, and for the year ended December 31, 2011, our effective tax rate was also impacted by higher taxes associated
with the Finint and Costa remeasurement gains. The tax rate for the year ended December 31, 2010 was impacted by a cumulative
tax planning benefit from certain foreign acquisitions and the settlement with the IRS of certain issues relating to the 2002-2004
tax years.
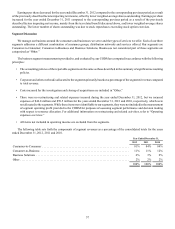
We continue to benefit from a significant proportion of profits being foreign-derived, and therefore taxed at lower rates than
our combined federal and state tax rates in the United States. For the years ended December 31, 2012, 2011 and 2010, 92%, 67%
and 87% of our pre-tax income was derived from foreign sources, respectively. Our foreign pre-tax income is subject to tax in
multiple foreign jurisdictions, virtually all of which have statutory income tax rates lower than the United States. While the income
tax imposed by any one foreign country is not material to us, our overall effective tax rate could be adversely affected by changes
in tax laws, both foreign and domestic. Certain portions of our foreign source income are subject to United States federal and state
income tax as earned due to the nature of the income, and dividend repatriations of our foreign source income are generally subject
to United States federal and state income tax.
We have established contingency reserves for a variety of material, known tax exposures. As of December 31, 2012, the total
amount of tax contingency reserves was $111.9 million, including accrued interest and penalties, net of related benefits. Our tax
reserves reflect our judgment as to the resolution of the issues involved if subject to judicial review or other settlement. While we
believe that our reserves are adequate to cover reasonably expected tax risks, there can be no assurance that, in all instances, an
issue raised by a tax authority will be resolved at a financial cost that does not exceed our related reserve. With respect to these
reserves, our income tax expense would include (i) any changes in tax reserves arising from material changes during the period
in facts and circumstances (i.e. new information) surrounding a tax issue and (ii) any difference from our tax position as recorded
in the financial statements and the final resolution of a tax issue during the period. Such resolution could materially increase or
decrease income tax expense in our consolidated financial statements in future periods and could impact our operating cash flows.
Earnings per share
During the years ended December 31, 2012, 2011 and 2010, basic earnings per share were $1.70, $1.85 and $1.37, respectively,
and diluted earnings per share were $1.69, $1.84 and $1.36, respectively. Unvested shares of restricted stock are excluded from
basic shares outstanding. Diluted earnings per share reflects the potential dilution that could occur if outstanding stock options at
the presented dates are exercised and shares of restricted stock have vested. As of December 31, 2012, 2011 and 2010, there were
23.3 million, 17.1 million and 34.0 million, respectively, of outstanding options to purchase shares of Western Union stock excluded
from the diluted earnings per share calculation under the treasury stock method as their effect was anti-dilutive. Of the 27.0 million,
30.7 million and 37.5 million outstanding options to purchase shares of our common stock as of December 31, 2012, 2011 and
2010, respectively, approximately 26%, 32% and 35%, respectively, were held by employees of First Data.