Western Union 2012 Annual Report Download - page 100
Download and view the complete annual report
Please find page 100 of the 2012 Western Union annual report below. You can navigate through the pages in the report by either clicking on the pages listed below, or by using the keyword search tool below to find specific information within the annual report.-
 1
1 -
2
-
3
-
4
-
5
-
6
-
7
-
8
-
9
-
10
-
11
-
12
-
13
-
14
-
15
-
16
-
17
-
18
-
19
-
20
-
21
-
22
-
23
-
24
-
25
-
26
-
27
-
28
-
29
-
30
-
31
-
32
-
33
-
34
-
35
-
36
-
37
-
38
-
39
-
40
-
41
-
42
-
43
-
44
-
45
-
46
-
47
-
48
-
49
-
50
-
51
-
52
-
53
-
54
-
55
-
56
-
57
-
58
-
59
-
60
-
61
-
62
-
63
-
64
-
65
-
66
-
67
-
68
-
69
-
70
-
71
-
72
-
73
-
74
-
75
-
76
-
77
-
78
-
79
-
80
-
81
-
82
-
83
-
84
-
85
-
86
-
87
-
88
-
89
-
 90
90 -
 91
91 -
 92
92 -
 93
93 -
 94
94 -
 95
95 -
 96
96 -
 97
97 -
 98
98 -
 99
99 -
 100
100 -
 101
101 -
 102
102 -
 103
103 -
 104
104 -
 105
105 -
 106
106 -
 107
107 -
 108
108 -
 109
109 -
 110
110 -
111
-
112
-
113
-
114
-
115
-
116
-
117
-
118
-
119
-
120
-
121
-
122
-
123
-
124
-
125
-
126
-
127
-
128
-
129
-
130
-
131
-
132
-
133
-
134
-
135
-
136
-
137
-
138
-
139
-
140
-
141
-
142
-
143
-
144
-
145
-
146
-
147
-
148
-
149
-
150
-
151
-
152
-
153
-
154
-
155
-
156
-
157
-
158
 |
 |

THE WESTERN UNION COMPANY
NOTES TO CONSOLIDATED FINANCIAL STATEMENTS (Continued)
95
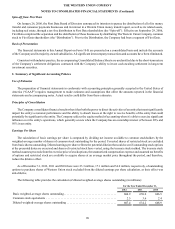
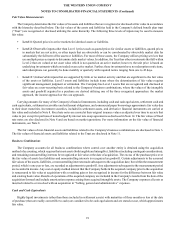
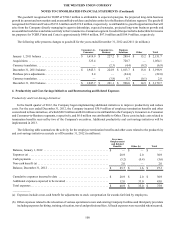
The following table provides the components of other intangible assets (in millions):
December 31, 2012 December 31, 2011
Weighted-
Average
Amortization
Period
(in years) Initial Cost
Net of
Accumulated
Amortization Initial Cost
Net of
Accumulated
Amortization
Acquired contracts . . . . . . . . . . . . . . . . . . . . . . . 11.3 $ 627.2 $ 466.2 $ 629.5 $ 526.5
Capitalized contract costs . . . . . . . . . . . . . . . . . . 6.1 457.2 303.7 399.1 213.8
Internal use software. . . . . . . . . . . . . . . . . . . . . . 3.2 221.0 54.7 197.4 61.0
Acquired trademarks. . . . . . . . . . . . . . . . . . . . . . 22.7 43.4 28.4 41.5 31.0
Projects in process . . . . . . . . . . . . . . . . . . . . . . . 3.0 15.4 15.4 0.8 0.8
Other intangibles . . . . . . . . . . . . . . . . . . . . . . . . . 2.7 34.4 10.5 41.6 14.3
Total other intangible assets . . . . . . . . . . . . . . . . 8.4 $ 1,398.6 $ 878.9 $ 1,309.9 $ 847.4
The estimated future aggregate amortization expense for existing other intangible assets as of December 31, 2012 is expected
to be $188.4 million in 2013, $161.0 million in 2014, $117.4 million in 2015, $89.7 million in 2016, $75.0 million in 2017 and
$247.4 million thereafter.
Other intangible assets are reviewed for impairment on an annual basis and whenever events or changes in circumstances
indicate that their carrying amount may not be recoverable. In such reviews, estimated undiscounted cash flows associated with
these assets or operations are compared with their carrying values to determine if a write-down to fair value (normally measured
by the present value technique) is required. The Company did not record any impairment related to other intangible assets during
the years ended December 31, 2012 and 2011, and recorded impairments of approximately $9 million for the year ended
December 31, 2010.
Revenue Recognition
The Company's revenues are primarily derived from consumer money transfer transaction fees that are based on the principal
amount of the money transfer and the locations from and to which funds are transferred. The Company also offers several global
payments services, including payments from consumers or businesses to other businesses. Transaction fees are set by the Company
and recorded as revenue at the time of sale.
In certain consumer money transfer and Business Solutions transactions involving different currencies, the Company generates
revenue based on the difference between the exchange rate set by the Company to the customer and the rate at which the Company
or its agents are able to acquire the currency. This foreign exchange revenue is recorded at the time the related consumer money
transfer transaction fee revenue is recognized or at the time a customer initiates a transaction through the Company's Business
Solutions payment service operations.
Cost of Services
Cost of services primarily consists of agent commissions and expenses for call centers, settlement operations and related
information technology costs. Expenses within these functions include personnel, software, equipment, telecommunications, bank
fees, depreciation, amortization and other expenses incurred in connection with providing money transfer and other payment
services.