Western Union 2012 Annual Report Download - page 70
Download and view the complete annual report
Please find page 70 of the 2012 Western Union annual report below. You can navigate through the pages in the report by either clicking on the pages listed below, or by using the keyword search tool below to find specific information within the annual report.-
 1
1 -
2
-
3
-
4
-
5
-
6
-
7
-
8
-
9
-
10
-
11
-
12
-
13
-
14
-
15
-
16
-
17
-
18
-
19
-
20
-
21
-
22
-
23
-
24
-
25
-
26
-
27
-
28
-
29
-
30
-
31
-
32
-
33
-
34
-
35
-
36
-
37
-
38
-
39
-
40
-
41
-
42
-
43
-
44
-
45
-
46
-
47
-
48
-
49
-
50
-
51
-
52
-
53
-
54
-
55
-
56
-
57
-
58
-
59
-
 60
60 -
 61
61 -
 62
62 -
 63
63 -
 64
64 -
 65
65 -
 66
66 -
 67
67 -
 68
68 -
 69
69 -
 70
70 -
 71
71 -
 72
72 -
 73
73 -
 74
74 -
 75
75 -
 76
76 -
 77
77 -
 78
78 -
 79
79 -
 80
80 -
81
-
82
-
83
-
84
-
85
-
86
-
87
-
88
-
89
-
90
-
91
-
92
-
93
-
94
-
95
-
96
-
97
-
98
-
99
-
100
-
101
-
102
-
103
-
104
-
105
-
106
-
107
-
108
-
109
-
110
-
111
-
112
-
113
-
114
-
115
-
116
-
117
-
118
-
119
-
120
-
121
-
122
-
123
-
124
-
125
-
126
-
127
-
128
-
129
-
130
-
131
-
132
-
133
-
134
-
135
-
136
-
137
-
138
-
139
-
140
-
141
-
142
-
143
-
144
-
145
-
146
-
147
-
148
-
149
-
150
-
151
-
152
-
153
-
154
-
155
-
156
-
157
-
158
 |
 |

65
Cash Flows from Operating Activities
During the years ended December 31, 2012, 2011 and 2010, cash provided by operating activities was $1,185.3 million,
$1,174.9 million and $994.4 million, respectively. During 2012, we made tax payments of $92.4 million as a result of the IRS
Agreement. In the first quarter of 2010, we made a $250 million tax deposit relating to United States federal tax liabilities, including
those arising from our 2003 international restructuring, which had been previously accrued in our consolidated financial statements.
Financing Resources
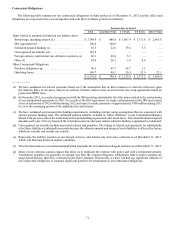
As of December 31, 2012, we had the following outstanding borrowings (in millions):
Due in less than one year:
Floating rate notes (effective rate of 0.9%) due 2013 . . . . . . . . . . . . . . . . . . . . . . . . . . . . . . . . . . . . . . . . . $ 300.0
Due in greater than one year (a):
6.500% notes (effective rate of 5.6%) due 2014 . . . . . . . . . . . . . . . . . . . . . . . . . . . . . . . . . . . . . . . . . . . . . 500.0
2.375% notes (effective rate of 2.4%) due 2015 (b) . . . . . . . . . . . . . . . . . . . . . . . . . . . . . . . . . . . . . . . . . . 250.0
5.930% notes due 2016 (c). . . . . . . . . . . . . . . . . . . . . . . . . . . . . . . . . . . . . . . . . . . . . . . . . . . . . . . . . . . . . . 1,000.0
2.875% notes (effective rate of 3.0%) due 2017 (b) . . . . . . . . . . . . . . . . . . . . . . . . . . . . . . . . . . . . . . . . . . 500.0
3.650% notes (effective rate of 4.4%) due 2018 . . . . . . . . . . . . . . . . . . . . . . . . . . . . . . . . . . . . . . . . . . . . . 400.0
5.253% notes due 2020 (c). . . . . . . . . . . . . . . . . . . . . . . . . . . . . . . . . . . . . . . . . . . . . . . . . . . . . . . . . . . . . . 324.9
6.200% notes due 2036 (c). . . . . . . . . . . . . . . . . . . . . . . . . . . . . . . . . . . . . . . . . . . . . . . . . . . . . . . . . . . . . . 500.0
6.200% notes due 2040 (c). . . . . . . . . . . . . . . . . . . . . . . . . . . . . . . . . . . . . . . . . . . . . . . . . . . . . . . . . . . . . . 250.0
Other borrowings . . . . . . . . . . . . . . . . . . . . . . . . . . . . . . . . . . . . . . . . . . . . . . . . . . . . . . . . . . . . . . . . . . . . . 5.8
Total borrowings at par value . . . . . . . . . . . . . . . . . . . . . . . . . . . . . . . . . . . . . . . . . . . . . . . . . . . . . . . . . . . . . 4,030.7
Fair value hedge accounting adjustments, net (a) . . . . . . . . . . . . . . . . . . . . . . . . . . . . . . . . . . . . . . . . . . . . 20.2
Unamortized discount, net . . . . . . . . . . . . . . . . . . . . . . . . . . . . . . . . . . . . . . . . . . . . . . . . . . . . . . . . . . . . . . (21.7)
Total borrowings at carrying value (d) . . . . . . . . . . . . . . . . . . . . . . . . . . . . . . . . . . . . . . . . . . . . . . . . . . . . . . $ 4,029.2
____________
(a) We utilize interest rate swaps designated as fair value hedges to effectively change the interest rate payments on a portion
of our notes from fixed-rate payments to short-term LIBOR-based variable rate payments in order to manage our overall
exposure to interest rates. The changes in fair value of these interest rate swaps result in an offsetting hedge accounting
adjustment recorded to the carrying value of the related note. These hedge accounting adjustments will be reclassified as
reductions to or increases in “Interest expense” in our Consolidated Statements of Income over the life of the related notes,
and cause the effective rate of interest to differ from the notes’ stated rate.
(b) On December 10, 2012, we issued $250.0 million of aggregate principal amount of 2.375% unsecured fixed rate notes due
2015 (“2015 Notes”) and $500.0 million of aggregate principal amount of 2.875% unsecured fixed rate notes due 2017
(“2017 Notes”). The interest rate on the 2015 Notes and 2017 Notes may be adjusted under certain circumstances as described
below.
(c) The difference between the stated interest rate and the effective interest rate is not significant.
(d) As of December 31, 2012, our weighted-average effective rate on total borrowings was approximately 4.8%.
Commercial Paper Program
Pursuant to our commercial paper program, we may issue unsecured commercial paper notes in an amount not to exceed $1.5
billion outstanding at any time, reduced to the extent of borrowings outstanding on our Revolving Credit Facility. Our commercial
paper borrowings may have maturities of up to 397 days from date of issuance. Interest rates for borrowings are based on market
rates at the time of issuance. We had no commercial paper borrowings outstanding as of December 31, 2012. During the year
ended December 31, 2012, the average commercial paper balance outstanding was $161.3 million and the maximum balance
outstanding was $422.8 million. Proceeds from our commercial paper borrowings were used for general corporate purposes.