Western Union 2012 Annual Report Download - page 127
Download and view the complete annual report
Please find page 127 of the 2012 Western Union annual report below. You can navigate through the pages in the report by either clicking on the pages listed below, or by using the keyword search tool below to find specific information within the annual report.-
 1
1 -
2
-
3
-
4
-
5
-
6
-
7
-
8
-
9
-
10
-
11
-
12
-
13
-
14
-
15
-
16
-
17
-
18
-
19
-
20
-
21
-
22
-
23
-
24
-
25
-
26
-
27
-
28
-
29
-
30
-
31
-
32
-
33
-
34
-
35
-
36
-
37
-
38
-
39
-
40
-
41
-
42
-
43
-
44
-
45
-
46
-
47
-
48
-
49
-
50
-
51
-
52
-
53
-
54
-
55
-
56
-
57
-
58
-
59
-
60
-
61
-
62
-
63
-
64
-
65
-
66
-
67
-
68
-
69
-
70
-
71
-
72
-
73
-
74
-
75
-
76
-
77
-
78
-
79
-
80
-
81
-
82
-
83
-
84
-
85
-
86
-
87
-
88
-
89
-
90
-
91
-
92
-
93
-
94
-
95
-
96
-
97
-
98
-
99
-
100
-
101
-
102
-
103
-
104
-
105
-
106
-
107
-
108
-
109
-
110
-
111
-
112
-
113
-
114
-
115
-
116
-
 117
117 -
 118
118 -
 119
119 -
 120
120 -
 121
121 -
 122
122 -
 123
123 -
 124
124 -
 125
125 -
 126
126 -
 127
127 -
 128
128 -
 129
129 -
 130
130 -
 131
131 -
 132
132 -
 133
133 -
 134
134 -
 135
135 -
 136
136 -
 137
137 -
138
-
139
-
140
-
141
-
142
-
143
-
144
-
145
-
146
-
147
-
148
-
149
-
150
-
151
-
152
-
153
-
154
-
155
-
156
-
157
-
158
 |
 |

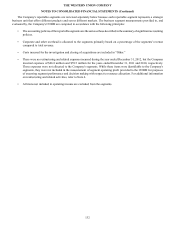
THE WESTERN UNION COMPANY
NOTES TO CONSOLIDATED FINANCIAL STATEMENTS (Continued)
122
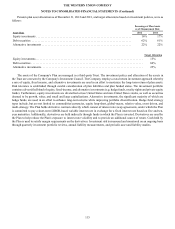
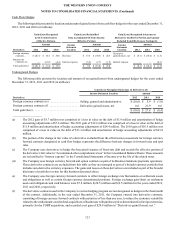
Balance Sheet
The following table summarizes the fair value of derivatives reported in the Consolidated Balance Sheets as of
December 31, 2012 and December 31, 2011 (in millions):
Derivative Assets Derivative Liabilities
Fair Value Fair Value
Balance Sheet
Location
December 31,
2012
December 31,
2011
Balance Sheet
Location
December 31,
2012
December 31,
2011
Derivatives — hedges:
Interest rate fair value
hedges — Corporate . . . . . . . . . . . Other assets $ 13.1 $ 4.4 Other liabilities $ — $ —
Foreign currency cash flow hedges
— Consumer-to-Consumer . . . . . . Other assets 10.8 37.0 Other liabilities 17.6 6.6
Total . . . . . . . . . . . . . . . . . . . . . . . . . . $ 23.9 $ 41.4 $ 17.6 $ 6.6
Derivatives — undesignated:
Foreign currency — Business
Solutions . . . . . . . . . . . . . . . . . . . . Other assets $ 71.9 $ 79.8 Other liabilities $ 66.5 $ 67.6
Foreign currency — Consumer-to-
Consumer. . . . . . . . . . . . . . . . . . . . Other assets 1.0 3.6 Other liabilities 2.0 12.4
Total . . . . . . . . . . . . . . . . . . . . . . . . . . $ 72.9 $ 83.4 $ 68.5 $ 80.0
Total derivatives . . . . . . . . . . . . . . . . . . $ 96.8 $ 124.8 $ 86.1 $ 86.6
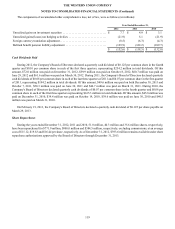
The following table summarizes the net fair value of derivatives held as of December 31, 2012 and their expected
maturities (in millions):
Total 2013 2014 Thereafter
Foreign currency cash flow hedges — Consumer-to-Consumer . . . . . . . . . . . . . . . . . . . . . $ (6.8) $ (1.8) $ (5.0) $ —
Foreign currency undesignated hedges — Consumer-to-Consumer . . . . . . . . . . . . . . . . . . (1.0) (1.0) — —
Foreign currency undesignated hedges — Business Solutions. . . . . . . . . . . . . . . . . . . . . . . 5.4 5.4 — —
Interest rate fair value hedges — Corporate . . . . . . . . . . . . . . . . . . . . . . . . . . . . . . . . . . . . . 13.1 — 12.9 0.2
Total . . . . . . . . . . . . . . . . . . . . . . . . . . . . . . . . . . . . . . . . . . . . . . . . . . . . . . . . . . . . . . . . . . . $ 10.7 $ 2.6 $ 7.9 $ 0.2
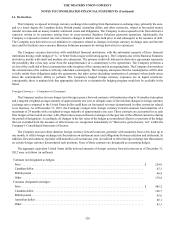
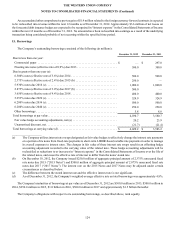
Income Statement
The following tables summarize the location and amount of gains and losses of derivatives in the Consolidated Statements
of Income segregated by designated, qualifying hedging instruments and those that are not, for the years ended December 31,
2012, 2011 and 2010 (in millions):
Fair Value Hedges
The following table presents the location and amount of gains/(losses) from fair value hedges for the years ended December 31,
2012, 2011 and 2010 (in millions):
Gain/(Loss) Recognized in Income on
Derivatives
Gain/(Loss) Recognized in Income on
Related Hedged Item (a)
Income
Statement
Location
Amount Income
Statement
Location
Amount
Derivatives 2012 2011 2010 Hedged Item 2012 2011 2010
Interest rate contracts . . . . . . . . Interest expense $ 3.9 $ 11.8 $ 13.3 Fixed-rate debt Interest expense $ 3.7 $ 12.6 $ 10.5
Total gain . . . . . . . . . . . . . . . . . $ 3.9 $ 11.8 $ 13.3 $ 3.7 $ 12.6 $ 10.5