Western Union 2012 Annual Report Download - page 105
Download and view the complete annual report
Please find page 105 of the 2012 Western Union annual report below. You can navigate through the pages in the report by either clicking on the pages listed below, or by using the keyword search tool below to find specific information within the annual report.-
 1
1 -
2
-
3
-
4
-
5
-
6
-
7
-
8
-
9
-
10
-
11
-
12
-
13
-
14
-
15
-
16
-
17
-
18
-
19
-
20
-
21
-
22
-
23
-
24
-
25
-
26
-
27
-
28
-
29
-
30
-
31
-
32
-
33
-
34
-
35
-
36
-
37
-
38
-
39
-
40
-
41
-
42
-
43
-
44
-
45
-
46
-
47
-
48
-
49
-
50
-
51
-
52
-
53
-
54
-
55
-
56
-
57
-
58
-
59
-
60
-
61
-
62
-
63
-
64
-
65
-
66
-
67
-
68
-
69
-
70
-
71
-
72
-
73
-
74
-
75
-
76
-
77
-
78
-
79
-
80
-
81
-
82
-
83
-
84
-
85
-
86
-
87
-
88
-
89
-
90
-
91
-
92
-
93
-
94
-
 95
95 -
 96
96 -
 97
97 -
 98
98 -
 99
99 -
 100
100 -
 101
101 -
 102
102 -
 103
103 -
 104
104 -
 105
105 -
 106
106 -
 107
107 -
 108
108 -
 109
109 -
 110
110 -
 111
111 -
 112
112 -
 113
113 -
 114
114 -
 115
115 -
116
-
117
-
118
-
119
-
120
-
121
-
122
-
123
-
124
-
125
-
126
-
127
-
128
-
129
-
130
-
131
-
132
-
133
-
134
-
135
-
136
-
137
-
138
-
139
-
140
-
141
-
142
-
143
-
144
-
145
-
146
-
147
-
148
-
149
-
150
-
151
-
152
-
153
-
154
-
155
-
156
-
157
-
158
 |
 |

THE WESTERN UNION COMPANY
NOTES TO CONSOLIDATED FINANCIAL STATEMENTS (Continued)
100
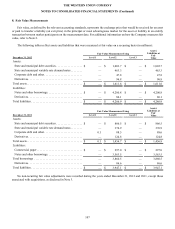
The goodwill recognized for TGBP of $704.3 million is attributable to expected synergies, the projected long-term business
growth in current and new markets and an assembled workforce and relates entirely to the Business Solutions segment. The goodwill
recognized for Finint and Costa of $153.6 million and $174.2 million, respectively, is attributable to growth opportunities that will
arise from the Company directly managing its agent relationships, expected synergies, projected long-term business growth and
an assembled workforce and relates entirely to the Consumer-to-Consumer segment. Goodwill expected to be deductible for income
tax purposes for TGBP, Finint and Costa is approximately $488.4 million, $97.0 million and $104.9 million, respectively.
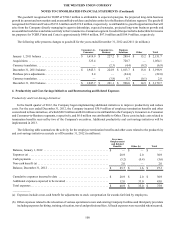
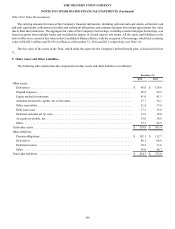
The following table presents changes to goodwill for the years ended December 31, 2012 and 2011 (in millions):
Consumer-to-
Consumer
Consumer-to-
Business
Business
Solutions Other Total
January 1, 2011 balance . . . . . . . . . . . . . . . . . . . . . . . . . . $ 1,619.9 $ 227.2 $ 289.4 $ 15.2 $ 2,151.7
Acquisitions . . . . . . . . . . . . . . . . . . . . . . . . . . . . . . . . . . . 325.4 — 728.7 — 1,054.1
Currency translation . . . . . . . . . . . . . . . . . . . . . . . . . . . . . —(2.3)(4.4)(0.2)(6.9)
December 31, 2011 balance . . . . . . . . . . . . . . . . . . . . . . . $ 1,945.3 $ 224.9 $ 1,013.7 $ 15.0 $ 3,198.9
Purchase price adjustments. . . . . . . . . . . . . . . . . . . . . . . . 2.4 — (24.4)—
(22.0)
Currency translation . . . . . . . . . . . . . . . . . . . . . . . . . . . . . —(3.8) 6.7 (0.1) 2.8
December 31, 2012 balance . . . . . . . . . . . . . . . . . . . . . . . $ 1,947.7 $ 221.1 $ 996.0 $ 14.9 $ 3,179.7
4. Productivity and Cost-Savings Initiatives and Restructuring and Related Expenses
Productivity and Cost-Savings Initiatives
In the fourth quarter of 2012, the Company began implementing additional initiatives to improve productivity and reduce
costs. For the year ended December 31, 2012, the Company incurred $30.9 million of employee termination benefits and other
costs related to these initiatives, of which $20.9 million and $4.0 million were attributable to the Company's Consumer-to-Consumer
and Consumer-to-Business segments, respectively, and $6.0 million was attributable to Other. These costs include costs related to
termination benefits received by two of the Company's executives. Additional productivity and cost-savings initiatives will be
implemented in 2013.
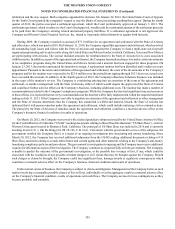
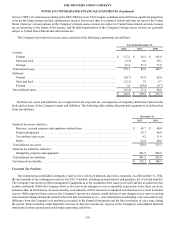
The following table summarizes the activity for the employee termination benefits and other costs related to the productivity
and cost-savings initiatives accruals as of December 31, 2012 (in millions):
Severance,
Outplacement
and Related
Benefits Other (b) Total
Balance, January 1, 2012 . . . . . . . . . . . . . . . . . . . . . . . . . . . . . . . . . . . . . . . . . . . . $—$—$—
Expenses (a) . . . . . . . . . . . . . . . . . . . . . . . . . . . . . . . . . . . . . . . . . . . . . . . . . . . . . . 28.9 2.0 30.9
Cash payments . . . . . . . . . . . . . . . . . . . . . . . . . . . . . . . . . . . . . . . . . . . . . . . . . . . . (5.2)(0.4)(5.6)
Non-cash benefit (a) . . . . . . . . . . . . . . . . . . . . . . . . . . . . . . . . . . . . . . . . . . . . . . . . 2.0 — 2.0
Balance, December 31, 2012 . . . . . . . . . . . . . . . . . . . . . . . . . . . . . . . . . . . . . . . . . $ 25.7 $ 1.6 $ 27.3
Cumulative expenses incurred to date . . . . . . . . . . . . . . . . . . . . . . . . . . . . . . . . . . $ 28.9 $ 2.0 $ 30.9
Additional expenses expected to be incurred . . . . . . . . . . . . . . . . . . . . . . . . . . . . . 12.0 33.0 45.0
Total expenses . . . . . . . . . . . . . . . . . . . . . . . . . . . . . . . . . . . . . . . . . . . . . . . . . . . . . $ 40.9 $ 35.0 $ 75.9
____________
(a) Expenses include a non-cash benefit for adjustments to stock compensation for awards forfeited by employees.
(b) Other expenses related to the relocation of various operations to new and existing Company facilities and third-party providers
including expenses for hiring, training, relocation, travel and professional fees. All such expenses were recorded when incurred.