Western Union 2012 Annual Report Download - page 128
Download and view the complete annual report
Please find page 128 of the 2012 Western Union annual report below. You can navigate through the pages in the report by either clicking on the pages listed below, or by using the keyword search tool below to find specific information within the annual report.-
 1
1 -
2
-
3
-
4
-
5
-
6
-
7
-
8
-
9
-
10
-
11
-
12
-
13
-
14
-
15
-
16
-
17
-
18
-
19
-
20
-
21
-
22
-
23
-
24
-
25
-
26
-
27
-
28
-
29
-
30
-
31
-
32
-
33
-
34
-
35
-
36
-
37
-
38
-
39
-
40
-
41
-
42
-
43
-
44
-
45
-
46
-
47
-
48
-
49
-
50
-
51
-
52
-
53
-
54
-
55
-
56
-
57
-
58
-
59
-
60
-
61
-
62
-
63
-
64
-
65
-
66
-
67
-
68
-
69
-
70
-
71
-
72
-
73
-
74
-
75
-
76
-
77
-
78
-
79
-
80
-
81
-
82
-
83
-
84
-
85
-
86
-
87
-
88
-
89
-
90
-
91
-
92
-
93
-
94
-
95
-
96
-
97
-
98
-
99
-
100
-
101
-
102
-
103
-
104
-
105
-
106
-
107
-
108
-
109
-
110
-
111
-
112
-
113
-
114
-
115
-
116
-
117
-
 118
118 -
 119
119 -
 120
120 -
 121
121 -
 122
122 -
 123
123 -
 124
124 -
 125
125 -
 126
126 -
 127
127 -
 128
128 -
 129
129 -
 130
130 -
 131
131 -
 132
132 -
 133
133 -
 134
134 -
 135
135 -
 136
136 -
 137
137 -
 138
138 -
139
-
140
-
141
-
142
-
143
-
144
-
145
-
146
-
147
-
148
-
149
-
150
-
151
-
152
-
153
-
154
-
155
-
156
-
157
-
158
 |
 |

THE WESTERN UNION COMPANY
NOTES TO CONSOLIDATED FINANCIAL STATEMENTS (Continued)
123
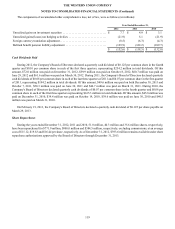
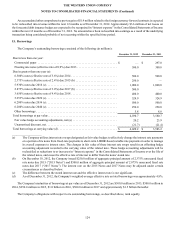
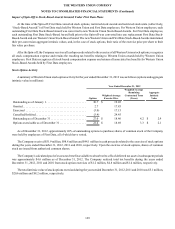
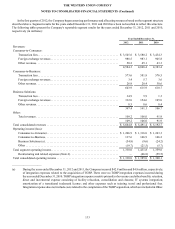
Cash Flow Hedges
The following table presents the location and amount of gains/(losses) from cash flow hedges for the years ended December 31,
2012, 2011 and 2010 (in millions):
Gain/(Loss) Recognized Gain/(Loss) Reclassified Gain/(Loss) Recognized in Income on
in OCI on Derivatives from Accumulated OCI into Income Derivatives (Ineffective Portion and Amount
(Effective Portion) (Effective Portion) Excluded from Effectiveness Testing) (b)
Amount Income
Statement
Location
Amount Income
Statement
Location
Amount
Derivatives 2012 2011 2010 2012 2011 2010 2012 2011 2010
Foreign currency
contracts. . . . . $ (20.1) $ 16.4 $ 20.0 Revenue $ 13.4 $ (30.3) $ 24.5
Derivative
gains/(losses), net $ (0.1) $ (10.2) $ (1.5)
Interest rate
contracts (c) . . — (21.6) (4.2) Interest expense (3.6) (2.7) (1.5) Interest expense — — (0.1)
Total gain/(loss) . $ (20.1) $ (5.2) $ 15.8 $ 9.8 $ (33.0) $ 23.0 $ (0.1) $ (10.2) $ (1.6)
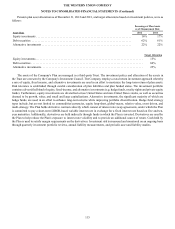
Undesignated Hedges
The following table presents the location and amount of net gains/(losses) from undesignated hedges for the years ended
December 31, 2012, 2011 and 2010 (in millions):
Gain/(Loss) Recognized in Income on Derivatives (d)
Income Statement Location Amount
Derivatives 2012 2011 2010
Foreign currency contracts (e) . . . . . . . . . . . . . . . . . . . . Selling, general and administrative $ (10.6) $ 5.9 $ (1.0)
Foreign currency contracts (f) . . . . . . . . . . . . . . . . . . . . Derivative gains/(losses), net 0.6 21.9 0.6
Total gain/(loss) . . . . . . . . . . . . . . . . . . . . . . . . . . . . . . . $(10.0) $ 27.8 $ (0.4)
____________________
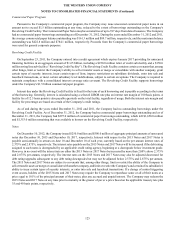
(a) The 2012 gain of $3.7 million was comprised of a loss in value on the debt of $3.9 million and amortization of hedge
accounting adjustments of $7.6 million. The 2011 gain of $12.6 million was comprised of a loss in value on the debt of
$11.8 million and amortization of hedge accounting adjustments of $24.4 million. The 2010 gain of $10.5 million was
comprised of a loss in value on the debt of $13.3 million and amortization of hedge accounting adjustments of $23.8
million.
(b) The portion of the change in fair value of a derivative excluded from the effectiveness assessment for foreign currency
forward contracts designated as cash flow hedges represents the difference between changes in forward rates and spot
rates.
(c) The Company uses derivatives to hedge the forecasted issuance of fixed-rate debt and records the effective portion of
the derivative’s fair value in “Accumulated other comprehensive loss” in the Consolidated Balance Sheets. These amounts
are reclassified to “Interest expense” in the Consolidated Statements of Income over the life of the related notes.
(d) The Company uses foreign currency forward and option contracts as part of its Business Solutions payments operations.
These derivative contracts are excluded from this table as they are managed as part of a broader currency portfolio that
includes non-derivative currency exposures. The gains and losses on these derivatives are included as part of the broader
disclosure of portfolio revenue for this business discussed above.
(e) The Company uses foreign currency forward contracts to offset foreign exchange rate fluctuations on settlement assets
and obligations as well as certain foreign currency denominated positions. Foreign exchange gain/(loss) on settlement
assets and obligations and cash balances were $7.8 million, $(20.5) million and $(2.5) million for the years ended 2012,
2011 and 2010, respectively.
(f) The derivative contracts used in the Company’s revenue hedging program are not designated as hedges in the final month
of the contract. Additionally, in the year ended December 31, 2011, the Company entered into derivative contracts,
consisting of foreign currency forward contracts with maturities of less than one year, to reduce the economic variability
related to the cash amounts used to fund acquisitions of businesses with purchase prices denominated in foreign currencies,
primarily for the TGBP acquisition, and recorded a net gain of $20.8 million in “Derivatives gains/(losses), net.”