Western Union 2012 Annual Report Download - page 66
Download and view the complete annual report
Please find page 66 of the 2012 Western Union annual report below. You can navigate through the pages in the report by either clicking on the pages listed below, or by using the keyword search tool below to find specific information within the annual report.-
 1
1 -
2
-
3
-
4
-
5
-
6
-
7
-
8
-
9
-
10
-
11
-
12
-
13
-
14
-
15
-
16
-
17
-
18
-
19
-
20
-
21
-
22
-
23
-
24
-
25
-
26
-
27
-
28
-
29
-
30
-
31
-
32
-
33
-
34
-
35
-
36
-
37
-
38
-
39
-
40
-
41
-
42
-
43
-
44
-
45
-
46
-
47
-
48
-
49
-
50
-
51
-
52
-
53
-
54
-
55
-
 56
56 -
 57
57 -
 58
58 -
 59
59 -
 60
60 -
 61
61 -
 62
62 -
 63
63 -
 64
64 -
 65
65 -
 66
66 -
 67
67 -
 68
68 -
 69
69 -
 70
70 -
 71
71 -
 72
72 -
 73
73 -
 74
74 -
 75
75 -
 76
76 -
77
-
78
-
79
-
80
-
81
-
82
-
83
-
84
-
85
-
86
-
87
-
88
-
89
-
90
-
91
-
92
-
93
-
94
-
95
-
96
-
97
-
98
-
99
-
100
-
101
-
102
-
103
-
104
-
105
-
106
-
107
-
108
-
109
-
110
-
111
-
112
-
113
-
114
-
115
-
116
-
117
-
118
-
119
-
120
-
121
-
122
-
123
-
124
-
125
-
126
-
127
-
128
-
129
-
130
-
131
-
132
-
133
-
134
-
135
-
136
-
137
-
138
-
139
-
140
-
141
-
142
-
143
-
144
-
145
-
146
-
147
-
148
-
149
-
150
-
151
-
152
-
153
-
154
-
155
-
156
-
157
-
158
 |
 |

61
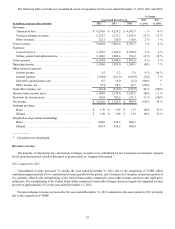
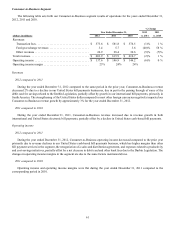
Consumer-to-Business Segment
The following table sets forth our Consumer-to-Business segment results of operations for the years ended December 31,
2012, 2011 and 2010.
% Change
Year Ended December 31, 2012 2011
(dollars in millions) 2012 2011 2010 vs. 2011 vs. 2010
Revenues:
Transaction fees . . . . . . . . . . . . . . . . . . . . . . . . . . . . . . . . . . . . $ 573.6 $ 581.8 $ 576.5 (1)% 1 %
Foreign exchange revenues . . . . . . . . . . . . . . . . . . . . . . . . . . . 3.4 5.7 3.6 (40)% 58 %
Other revenues . . . . . . . . . . . . . . . . . . . . . . . . . . . . . . . . . . . . . 26.9 28.4 30.6 (5)% (7)%
Total revenues . . . . . . . . . . . . . . . . . . . . . . . . . . . . . . . . . . . . . . . . $ 603.9 $ 615.9 $ 610.7 (2)% 1 %
Operating income . . . . . . . . . . . . . . . . . . . . . . . . . . . . . . . . . . . . . $ 137.6 $ 146.9 $ 146.2 (6)% 0 %
Operating income margin . . . . . . . . . . . . . . . . . . . . . . . . . . . . . . . 23% 24% 24%
Revenues
2012 compared to 2011
During the year ended December 31, 2012 compared to the same period in the prior year, Consumer-to-Business revenue
decreased 2% due to a decline in our United States bill payments businesses, due in part to the passing through of some of the
debit card fee savings related to the Durbin Legislation, partially offset by growth in our international bill payments, primarily in
South America. The strengthening of the United States dollar compared to most other foreign currencies negatively impacted our
Consumer-to-Business revenue growth by approximately 3% for the year ended December 31, 2012.
2011 compared to 2010
During the year ended December 31, 2011, Consumer-to-Business revenue increased due to revenue growth in both
international and United States electronic bill payments, partially offset by a decline in United States cash-based bill payments.
Operating income
2012 compared to 2011
During the year ended December 31, 2012, Consumer-to-Business operating income decreased compared to the prior year
primarily due to revenue declines in our United States cash-based bill payments business, which has higher margins than other
bill payment services in the segment, the renegotiation of a sales and distribution agreement, and expenses related to productivity
and cost-savings initiatives, partially offset by a net decrease in debit card and other bank fees due to the Durbin Legislation. The
changes in operating income margins in the segment are due to the same factors mentioned above.
2011 compared to 2010
Operating income and operating income margins were flat during the year ended December 31, 2011 compared to the
corresponding period in 2010.