Western Union 2012 Annual Report Download - page 54
Download and view the complete annual report
Please find page 54 of the 2012 Western Union annual report below. You can navigate through the pages in the report by either clicking on the pages listed below, or by using the keyword search tool below to find specific information within the annual report.-
 1
1 -
2
-
3
-
4
-
5
-
6
-
7
-
8
-
9
-
10
-
11
-
12
-
13
-
14
-
15
-
16
-
17
-
18
-
19
-
20
-
21
-
22
-
23
-
24
-
25
-
26
-
27
-
28
-
29
-
30
-
31
-
32
-
33
-
34
-
35
-
36
-
37
-
38
-
39
-
40
-
41
-
42
-
43
-
 44
44 -
 45
45 -
 46
46 -
 47
47 -
 48
48 -
 49
49 -
 50
50 -
 51
51 -
 52
52 -
 53
53 -
 54
54 -
 55
55 -
 56
56 -
 57
57 -
 58
58 -
 59
59 -
 60
60 -
 61
61 -
 62
62 -
 63
63 -
 64
64 -
65
-
66
-
67
-
68
-
69
-
70
-
71
-
72
-
73
-
74
-
75
-
76
-
77
-
78
-
79
-
80
-
81
-
82
-
83
-
84
-
85
-
86
-
87
-
88
-
89
-
90
-
91
-
92
-
93
-
94
-
95
-
96
-
97
-
98
-
99
-
100
-
101
-
102
-
103
-
104
-
105
-
106
-
107
-
108
-
109
-
110
-
111
-
112
-
113
-
114
-
115
-
116
-
117
-
118
-
119
-
120
-
121
-
122
-
123
-
124
-
125
-
126
-
127
-
128
-
129
-
130
-
131
-
132
-
133
-
134
-
135
-
136
-
137
-
138
-
139
-
140
-
141
-
142
-
143
-
144
-
145
-
146
-
147
-
148
-
149
-
150
-
151
-
152
-
153
-
154
-
155
-
156
-
157
-
158
 |
 |
49
• Our operating income margin was 23% during the year ended December 31, 2012, compared to 25% in the prior year. The
current year results include TGBP integration expenses; investments in our strategic initiatives, including westernunion.com;
increased compliance program costs; and productivity and cost-savings initiatives expenses. The prior year results include
the restructuring and related expenses and TGBP integration expenses, as mentioned above.
• Our effective tax rates were 12.2%, 8.6% and 20.5% for the years ended December 31, 2012, 2011 and 2010, respectively.
The significant decrease in our effective tax rate for the years ended December 31, 2012 and 2011 is primarily due to an
agreement with the United States Internal Revenue Service (“IRS Agreement”) resolving substantially all of the issues
related to our restructuring of our international operations in 2003. We continue to benefit from a significant proportion of
our profits being foreign-derived, and therefore taxed at lower rates than our combined federal and state tax rates in the
United States. For the years ended December 31, 2012, 2011 and 2010, 92%, 67% and 87% of our pre-tax income was
derived from foreign sources, respectively. While the income tax imposed by any one foreign country is not material to us,
our overall effective tax rate could be adversely affected by changes in tax laws, both foreign and domestic. Certain portions
of our foreign source income are subject to United States federal and state income tax as earned due to the nature of the
income, and dividend repatriations of our foreign source income are generally subject to United States federal and state
income tax.
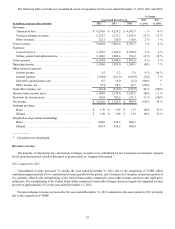
• Consolidated net income was $1,025.9 million and $1,165.4 million for the years ended December 31, 2012 and 2011,
respectively, representing a year-over-year decrease of 12%. Results for 2012 include $30.7 million and $20.2 million of
TGBP integration and productivity and cost-savings initiatives expenses, net of tax, respectively. The prior year results
include a $204.7 million tax benefit related to the adjustment of reserves associated with the IRS Agreement. Results for
2011 include $32.0 million and $3.1 million in restructuring and related expenses and TGBP integration expenses, net of
tax, respectively. In addition, for 2011, we recognized gains of $12.7 million and $18.3 million, net of tax, related to our
acquisitions of Finint S.r.l (“Finint”) and Angelo Costa S.r.l (“Costa”), respectively, and $13.5 million, net of tax, related
to foreign currency forward contracts entered into to reduce the economic variability related to the cash amounts used to
fund acquisitions of businesses with purchase prices denominated in foreign currencies, primarily for the TGBP acquisition.
• Our consumers transferred $79 billion and $81 billion in Consumer-to-Consumer principal for the years ended December 31,
2012 and 2011, respectively, of which $71 billion and $73 billion related to cross-border principal, respectively, which
represented a decrease of 2% and 3%, respectively, in Consumer-to-Consumer principal and cross-border principal over
the prior year.
• Consolidated cash flows provided by operating activities were $1,185.3 million and $1,174.9 million for the years ended
December 31, 2012 and 2011, respectively. Cash flows provided by operating activities for the year ended December 31,
2012 were impacted by tax payments of $92.4 million made as a result of the IRS Agreement.
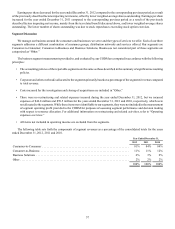
Our key strategic priorities are focused on:
• Strengthening consumer money transfer - We are implementing key actions in an effort to drive renewed growth in our
consumer money transfer business, including: improving the consumer value proposition by making pricing investments
in key corridors and enhancing services and the consumer experience; continuing to expand the digital and electronic account
based money transfer channels; and further expanding our agent network. We began to implement increased strategic fee
reductions and actions to adjust foreign exchange spreads in certain key corridors in the fourth quarter of 2012. We continued
such increased fee reductions and actions in the first quarter of 2013 and anticipate further fee reductions and foreign
exchange actions in 2013. Fee reductions and foreign exchange actions were approximately 1% of revenue for full year
2012. These actions are expected to increase to approximately 5% of total revenue for full year 2013, if all actions are
implemented as contemplated. We also plan to continue connecting the cash and digital worlds for our consumers. Digital
and electronic account based money transfer channels delivered strong growth and new customer acquisition in 2012, and
actions are planned to accelerate usage in 2013 through added capabilities, enhanced value propositions, and expanded
reach.
• Driving growth in customers and usage in Western Union Business Solutions - In Western Union Business Solutions, we
are working to increase product offerings, expand to new markets, and improve sales force effectiveness to drive new
customer acquisition and growth opportunities with existing customers.